Overview
- Temperatures rose in almost every county in six Southwestern states between 2001 and 2021.
- Crop insurance payments for heat-related damage in the region totaled over $1.3 billion during that time.
- As the climate crisis accelerates, crop insurance costs for heat damage are likely to continue to grow in the Southwest.
A new Environmental Working Group analysis shows a clear connection between rising temperatures linked to climate change in the Southwest and the region’s growing crop insurance costs for heat-related crop damage and losses.
Analyzing weather data from the National Oceanic and Atmospheric Administration and Department of Agriculture, EWG researchers found that average annual temperatures increased in almost all counties in the Southwestern states of Arizona, California, Colorado, Nevada, New Mexico and Utah between 2001 and 2021 – and that many of those counties also saw crop insurance costs for heat-related losses climb during that period.
Parts of the region saw record-high temperatures in that time, while crop insurance payments for farmers in the same Southwestern states totaled more than $1.3 billion.
In California, EWG researchers found an especially strong link between rising average temperatures and growing crop insurance costs for heat. See the California section below for more detail.
The rapidly intensifying climate crisis has already increased the cost of the Crop Insurance Program in other parts of the country, as it has in the Midwest, as EWG showed in a 2022 analysis. Costs are likely to continue to rise without interventions that encourage farmers to adapt to climate change and the extreme weather associated with it.
As currently designed, the program discourages climate adaptation by shielding farmers from the true cost of policies and minimizing the risk to farmers of planting on marginal lands – among many other climate-unfriendly features in dire need of reform.
Conservation practices like cover crops can help farmers in the Southwest and beyond both adapt to the extreme weather caused and worsened by climate change and reduce their greenhouse gas emissions. But USDA conservation programs do not adequately fund or encourage the adoption of climate-smart practices. And demand for these programs is higher than capacity.
Farmers must be able to adopt more conservation practices that help them adapt to climate change without endangering their crop insurance policies.
The Southwest is getting hotter
According to the Fourth National Climate Assessment, the average annual temperature of the region went up by 1.6 degrees Fahrenheit between 1901 and 2016, with areas of Southern California and western Colorado showing the largest jumps. Since 2010, parts of the region have experienced their highest-ever recorded temperatures.
By analyzing NOAA data, we found that temperatures rose in 212 of the 216 counties in Arizona, California, Colorado, Nevada, New Mexico and Utah between 2001 and 2021. (See Methodology for more information.)
The National Climate Assessment predicts that annual average temperatures in the Southwest will rise by 8.6 ℉ by 2100 under the worst climate emissions scenario. That increase would cause droughts interspersed with sporadic extreme floods – as when 31 “atmospheric rivers” inundated a dangerously parched California in early 2023 between January and March.
The Southwest has many agriculturally important areas like California, which boasts the largest farm sales of any state and produces more than three-fourths of the nation’s fruits and nuts. Higher temperatures have already damaged agriculture in the region and, as the weather gets hotter, farming will continue getting harder.
Hotter temperatures are directly linked to rising crop insurance costs
Many indemnity payments are made for weather-related reductions in crop yield, so the Crop Insurance Program is inherently tied to the climate crisis.
Farmers in the six Southwest states got over $1.33 billion in crop insurance payments for reduced crop yields due to heat between 2001 and 2021. Across the region, heat generated the fourth highest total amount of payments out of all causes of loss (Figure 1). Nationally, heat was the sixth largest category of crop insurance payments during this period.
Figure 1. Heat was the fourth highest crop insurance cause of loss in the Southwest between 2001 and 2021.
|
Causes of loss with largest payments |
Crop insurance indemnities, 2001-2021 |
Rank |
|
GRP/GRIP/ARPI/SCO/STAX/MP/HIP WI crops only |
$2,003,132,351 |
1 |
|
Drought |
$1,387,366,411 |
2 |
|
Failure of irrigation supply |
$1,386,189,262 |
3 |
|
Heat |
$1,333,099,968 |
4 |
|
Excess moisture/precipitation/rain |
$1,140,439,996 |
5 |
|
Hail |
$829,928,687 |
6 |
|
Freeze |
$592,171,843 |
7 |
|
Wind/excess wind |
$326,240,536 |
8 |
|
Frost |
$318,600,956 |
9 |
|
Cold wet weather |
$276,683,902 |
10 |
Source: EWG, from the USDA Risk Management Agency, Cause of Loss Historical Data Files
Some insurance indemnities come from the money farmers pay for their premiums, but much is funded by taxpayers. Additional payments – when losses exceed premiums – are paid solely by taxpayers, as are premium subsidies. Taxpayers subsidize 62 percent of all premiums, on average.
Of the 216 counties in the Southwest, 121 – 56 percent – both experienced hotter weather and received a crop insurance indemnity payment for heat at some point during that time. (Not all counties in the Southwest are agricultural, so some of the counties did not receive any crop insurance payments for any reason.)
In all, federal payments for heat-related losses to these counties during the 21-year period totaled $1.32 billion – 14 percent – of the $9.35 billion in total crop insurance payments there.
Even more telling, over three-fourths of these counties had growing crop insurance indemnity payments for heat.
The map below shows the 121 Southwestern counties with both rising average annual temperatures and a heat-related crop insurance payment.
Map of Southwestern counties with increasing temps and a heat crop insurance indemnity
Over the period we studied, heat-related crop insurance costs – not just indemnities but also premium subsidies, policies and acres – went up in many of the 121 counties that both experienced rising average annual temperatures and received a payment for a heat-related loss.
Of these counties:
- 79 percent had increasing heat premium subsidies.
- 77 percent had increasing heat indemnities.
- 62 percent had an increasing number of policies that paid out indemnities for heat.
- 60 percent had increasing acres indemnified for heat.
Additionally, for some of these indicators, heat as a share of the program’s total cost or participation across all causes of loss grew.
Figure 2. Annual heat indemnities for the 121 counties that received payments and had rising temperatures went up between 2001 and 2021.
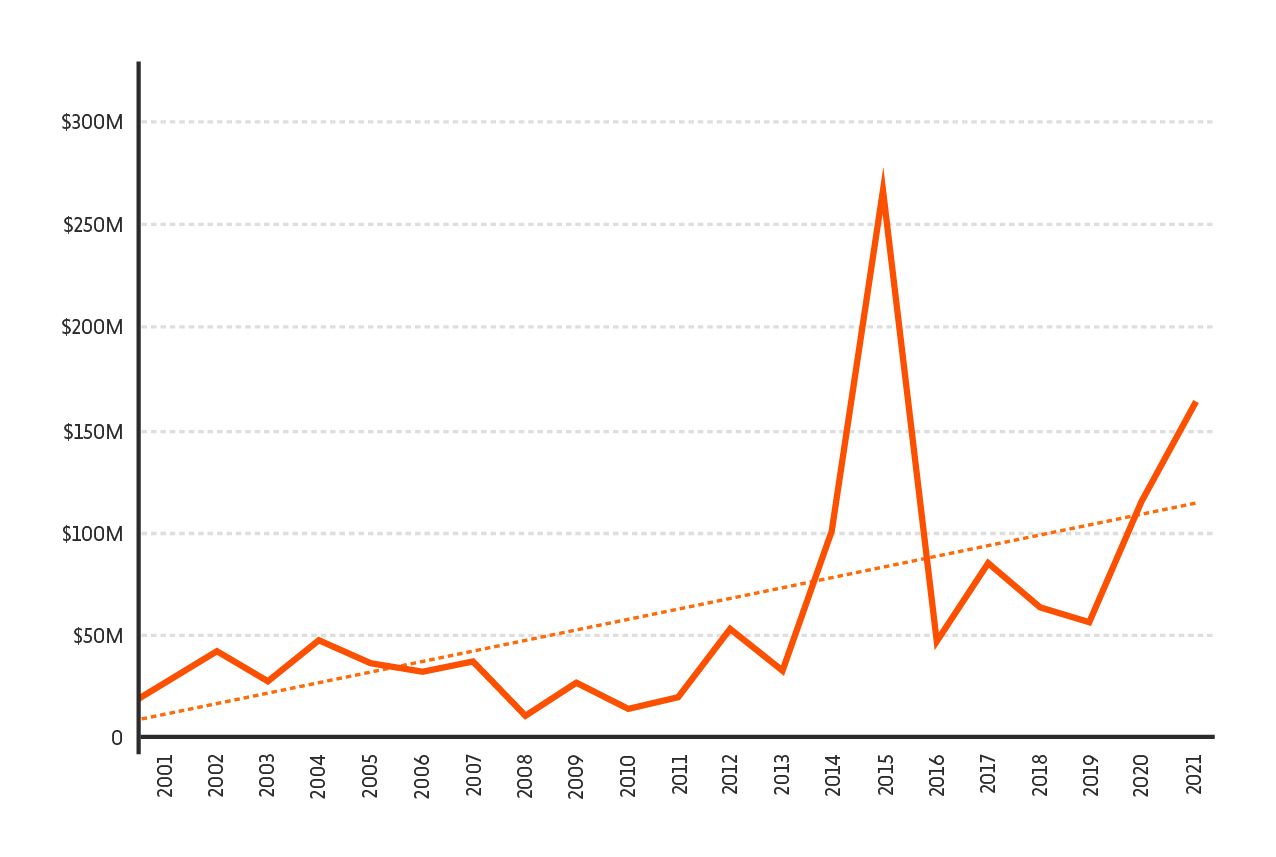
Source: EWG, from NOAA, Climate at a Glance and the USDA Risk Management Agency, Cause of Loss Historical Data Files
Rising temperatures and insurance costs hit California especially hard
California is the most important state in the Southwest for agriculture, and both rising temperatures and crop insurance costs for heat were more prevalent in the state than the Southwest region overall. In fact, heat was the number one cause of loss in California, with $1.1 billion in indemnities.
Average annual temperatures climbed in all of California’s 58 counties between 2001 and 2021, according to the NOAA data. Of these, an overwhelming majority – 47 counties, or 81 percent – got a crop insurance payment for heat at some point during those years. Heat accounted for 22 percent of total indemnities in these counties.
Of these counties:
- 98 percent had increasing heat premium subsidies.
- 98 percent had increasing heat indemnities.
- 85 percent had increasing policies indemnified for heat.
- 77 percent had increasing acres indemnified for heat.
Hotter temperatures also contribute to worsening drought conditions in California. Drought has already harmed California’s agriculture industry in recent years, and it is expected to wreak even more havoc as temperatures continue to warm.
Surprisingly, drought has driven far fewer crop insurance payments than heat in California. Drought ranked eleventh for indemnities in the state between 2001 and 2021 (Figure 3).
Still, the climate crisis is expected to make heat and drought worse in California, so crop insurance costs for both are also likely to grow.
Figure 3. In California, heat was the most expensive cause of loss between 2001 and 2021, and drought paid out the eleventh highest amount.
|
Causes of loss with largest payments in California |
Crop insurance indemnities, 2001-2021 |
Rank |
|
Heat |
$1,110,376,553 |
1 |
|
Excess moisture/precipitation/rain |
$1,019,587,219 |
2 |
|
Failure of irrigation supply |
$873,942,424 |
3 |
|
GRP/GRIP/ARPI/SCO/STAX/MP/HIP WI crops only |
$382,180,568 |
4 |
|
Freeze |
$377,359,372 |
5 |
|
Frost |
$293,886,600 |
6 |
|
Fire |
$273,144,590 |
7 |
|
Cold wet weather |
$253,089,777 |
8 |
|
Hail |
$147,711,147 |
9 |
|
Wind/excess wind |
$115,872,611 |
10 |
|
Drought |
$92,416,041 |
11 |
Source: EWG, from the USDA Risk Management Agency, Cause of Loss Historical Data Files
Reforms needed, but conservation can help
The federal Crop Insurance Program needs to be reformed to help farmers in the Southwest – and throughout the country – both adapt to the climate crisis and help tackle it. The many changes that should be made include reducing premium subsidies for the highest-risk farmers and factoring recent weather events and projected weather, climate and crop yield data into the insurance premium rating process.
Conservation practices can also help farmers adapt to extreme weather conditions, like high temperatures, made worse by climate change, and potentially reduce the costs of the federal Crop Insurance Program.
Counterintuitively, some conservation practices may disqualify farmers from participating in the Crop Insurance Program. Farmers may not be able to obtain crop insurance policies if they use certain conservation practices that could potentially reduce crop yields or practices about which not enough research has been conducted.
The USDA has created the Climate-Smart Agriculture and Forestry Mitigation Activities List to highlight conservation practices that mitigate greenhouse gas emissions. When these practices are implemented by farmers who participate in the agency’s Environmental Quality Incentives Program or Conservation Stewardship Program, their costs are shared with the government.
But many of the conservation practices on the list can also help farmers adapt to extreme heat. These practices include cover crops, reduced or no tillage, agroforestry practices like silvopasture, and use of mulch and compost.
To help farmers in the Southwest – especially in California – who grow specialty crops like fruits, vegetables and nuts adapt to more extreme heat, the USDA’s California Climate Hub recommends conservation practices like planting cover crops, using shade netting, optimizing planting to decrease direct sun exposure and using heat-tolerant crop types.
The 2023 Farm Bill is a historic opportunity to reform federal farm programs to encourage farmers to reduce their greenhouse gas emissions and adapt to climate change. It also provides a chance to reform our farm safety net to encourage farmers to switch to crops that require less water and can better withstand heat and drought.