A study of five representative Iowa counties shows that requiring simple buffer zones between crop fields and streams could get two-thirds of the way to the state’s goal for reducing phosphorus pollution and one-fifth of the way to the nitrogen pollution target, while affecting only a tiny proportion of landowners and a vanishingly small percentage of row-crop acreage.

The 2013 Iowa Nutrient Reduction Strategy committed the state to an ambitious goal of reducing phosphorus pollution from so-called nonpoint sources – mostly farm operations – by 29 percent, and nitrogen pollution by 41 percent. The science assessment that accompanied the strategy concluded that the simple step of putting 35-foot-wide grass strips between waterways and adjacent cropland could cut phosphorus runoff by 18 percent and nitrogen pollution by 7 percent.
Environmental Working Group used high-resolution aerial photography to assess the impact on Iowa’s farms of implementing streamside buffer standards of varying widths – 35 feet, 50 feet or 75 feet in Allamakee, Hamilton, Linn, Plymouth and Union counties
Source: National Agricultural Imagery Program, 2014.
Enacting a streamside buffer standard would affect only a handful of landowners and an almost undetectable effect on land in row crop production.
- Requiring a 35-foot buffer would affect only 8 percent of landowners and convert only 0.05 percent of corn and soybean acres in those counties.
- Even a 75-foot standard would affect only 13 percent of landowners and convert only 0.29 percent of corn and soybean acres.
- Seventy-one percent of landowners could meet the 50-foot standard by planting an acre or less to a grass buffer.
To EWG, that sounds like very low hanging fruit. Planting narrow strips of grass between cropland and waterways doesn’t seem too much to ask of landowners to jump start cleaning up Iowa’s chronically dirty water.
If Iowa is serious about cleaning up its waterways, enacting a streamside buffer standard of at least 50 feet would be an excellent way to start. Counties could take the initiative even in the absence of state action. See for yourself what we found:
Executive Summary
A study of five representative Iowa counties shows that requiring simple buffer zones between crop fields and streams could get two-thirds of the way to the state's goal for reducing phosphorus pollution and one-fifth of the way to the nitrogen pollution target, while affecting only a tiny proportion of landowners and a vanishingly small percentage of row-crop acreage.
The 2013 Iowa Nutrient Reduction Strategy committed the state to an ambitious goal of reducing phosphorus pollution from so-called nonpoint sources – mostly farm operations – by 29 percent, and nitrogen pollution by 41 percent. The science assessment that accompanied the strategy concluded that the simple step of putting 35-foot-wide grass strips between waterways and adjacent cropland could cut phosphorus runoff by 18 percent and nitrogen pollution by 7 percent.
Environmental Working Group used high-resolution aerial photography to assess the impact on Iowa's farms of implementing streamside buffer standards of varying widths – 35 feet, 50 feet or 75 feet. EWG picked five counties – Allamakee, Hamilton, Linn, Plymouth and Union – that represent Iowa's major landscape regions and reflect the wide county-to-county range in how much land is devoted to row crops.
The analysis showed that requiring a 50-foot buffer would affect only 11 percent of the landowners in those five counties – ranging from 8 percent in Linn County to 15 percent in Plymouth County. Moreover, only 0.12 percent of the corn and soybean row crop acreage would have to be replaced by permanent vegetation to meet a 50-foot requirement. Fully 71 percent of the affected landowners would only have to convert an acre or less to meet that standard.
To EWG, that sounds like very low hanging fruit. Planting narrow strips of grass between cropland and waterways – without compensation – doesn’t seem too much to ask of landowners, given the substantial public support they receive. Neighboring Minnesota already has a progressive zoning ordinance requiring 50-foot streamside buffers between crop fields and public waterways.
Can’t Iowa do as well?
The prospect of enacting a streamside buffer standard raises the most important policy issue facing Iowans tired of dirty water: What’s fair to expect landowners to do at their own cost as part of the responsibilities that come with the rights of ownership?
Landowners are expected to be good citizens – to fence their cattle out of their neighbors’ land, control noxious weeds before they spread to others’ fields and make sure that their herbicide sprays don't damage nearby crops. Why shouldn’t there be a similar standard of care to protect those who live downstream? It is unfair and bad policy to expect taxpayers to foot the bill for everything that farm operations need to do to clean up Iowa’s streams and rivers.
It is time to define a basic standard of care that agricultural landowners should be expected to meet. It should focus on those activities, such as planting crops too close to waterways, that cause a disproportionate share of the region’s water pollution and for which simple and effective solutions are readily available.
A streamside buffer standard fits those criteria perfectly. If Iowa is serious about cleaning up its waterways, a streamside buffer standard of at least 50 feet would be an excellent way to start. Counties could take the initiative even in the absence of state action.
Introduction
Water quality in Iowa is notoriously poor and is not getting any cleaner. The primary cause is fertilizer and manure that runs off farm operations. This polluted runoff overloads waterways with nitrogen and phosphorus and sets off a cascade of harms that threaten human health and often make fishing, swimming or paddling in streams and rivers a very unpleasant experience, especially in summer.
Moreover, the polluted runoff from farm operations in Iowa and other farm belt states eventually reaches the Gulf of Mexico, where every summer it helps to trigger the infamous Dead Zone where marine life cannot survive.
In 2008, a consortium of federal and state agencies produced the Gulf Hypoxia Action Plan that called on the 12 states bordering the Mississippi River to develop strategies to reduce nutrient pollution in order to shrink the size of the Dead Zone. In May 2013, Iowa responded with its Nutrient Reduction Strategy, which seeks to cut nitrogen pollution from nonpoint sources – mostly farm operations – by 41 percent and phosphorus pollution by 29 percent.
The accompanying science assessment evaluated the effectiveness of various measures that could stem polluted runoff.
The science assessment reported that putting 35-foot wide grass strips between Iowa’s waterways and adjacent cropland could cut phosphorus runoff by 18 percent and nitrogen pollution by 7 percent. By itself, this simple practice – called streamside buffers – would get the state almost two-thirds of the way toward the goal for cutting phosphorus pollution. It would also get nearly a fifth of the way toward the nitrogen pollution goal. Streamside buffers would also reduce the sediment that clogs Iowa’s waterways as well as create new wildlife habitat.
EWG analyzed five Iowa counties – using high-resolution aerial photography and geographic information systems – to see just how many landowners would be affected by a streamside buffer standard and how many acres of grass strips would be needed to create buffers 35-, 50- or 75-feet wide.
The Five Counties
Rather than take on the task of assessing every waterway in Iowa, EWG picked five counties – Allamakee, Hamilton, Linn, Plymouth and Union – chosen to reflect each of Iowa’s five major landscape regions (Figure 1).
Figure 1: The five counties are in each of Iowa’s major landscape regions.

We also selected these counties so as to reflect the wide county-to-county range in the percentage of land devoted to row crops (Table 1). For example, Hamilton County, in the center of the Des Moines Lobe landform, is almost entirely cultivated, while farming is far less prevalent in Allamakee County in northeast Iowa’s Paleozoic Plateau because of the region’s karst topography.
Table 1: Prevalence of row crops and miles and number of stream assessed in each county
| County | Percent of Land in Row Crops | Stream Miles Assessed | Number of Streams Assessed |
|---|---|---|---|
| Hamilton | >80% | 280 | 30 |
| Plymouth | >70% | 400 | 28 |
| Union | >60% | 270 | 24 |
| Linn | >50% | 430 | 40 |
| Allamakee | >20% | 362 | 38 |
EWG limited its assessment to named waterways in the US Geological Survey’s National Hydrography Dataset (NHD) in order to focus as much as possible on perennial waterways. Of the total of 1,742 stream miles across the five counties (Table 1), 81 percent are perennial, 15 percent are intermittent and 4 percent are ditches. For intermittent streams and ditches, we limited our assessment to those segments that have defined beds and banks.
Streamside Buffers
The five counties vary greatly in the acreage of streamside buffers currently in place along the waterways EWG assessed. In Allamakee County, 90 percent of the streamside buffer acreage needed to meet a 35-foot standard is already in place. Those acres represent 72 percent of the area needed to meet even a 75-foot standard. At the other end of the spectrum, in Plymouth County only 52 percent of the buffering acres needed to meet a 35-foot standard are present; they amount to just 34 percent the acreage needed to meet a 75-foot standard (Figure 2).
Figure 2: Counties varied in the amount of streamside buffer acres already in place
Interestingly, Hamilton County has the greatest concentration of cropland yet is in nearly as good shape as Allamakee County, which has the lowest. This is good news. Large amounts of cropland don’t necessarily mean poor streamside buffering.
Merely measuring the percentage of streamside acres in place for each possible buffer standard, however, obscures the huge differences among stream segments. Even in Allamakee County, for example, several stream segments do not currently meet the 35-foot standard. The situation in Plymouth County is especially grave. There existing streamside buffers don’t meet the 35-foot standard at any point along the stream segments EWG assessed. Overall, along the 160 unique streams and river segments EWG analyzed, 13 percent of the adjacent agricultural land had an adequate vegetative buffer strip of 35 feet, 8 percent had 50 feet completely buffered and 6 percent had 75-foot buffers (Table 2). On the flip side, 1 percent of streams and rivers fell more than 75 percent short of the acreage needed to meet a 35-foot standard, 4 percent were that far short of meeting a 50-foot requirement and 11 percent were that far from meeting a 75-foot standard.
Table 2. Percent of river/stream segments meeting standards*
| Stream/River Segment | 35 ft. | 50 ft. | 75 ft. |
|---|---|---|---|
| Completely Buffered | 13% | 8% | 6% |
| 75-99% buffered | 46% | 36% | 26% |
| 50-74% buffered | 23% | 31% | 30% |
| 25-49% buffered | 17% | 22% | 28% |
| 1-25% buffered | 1% | 4% | 11% |
* Columns don’t add up to 100 percent because of rounding.
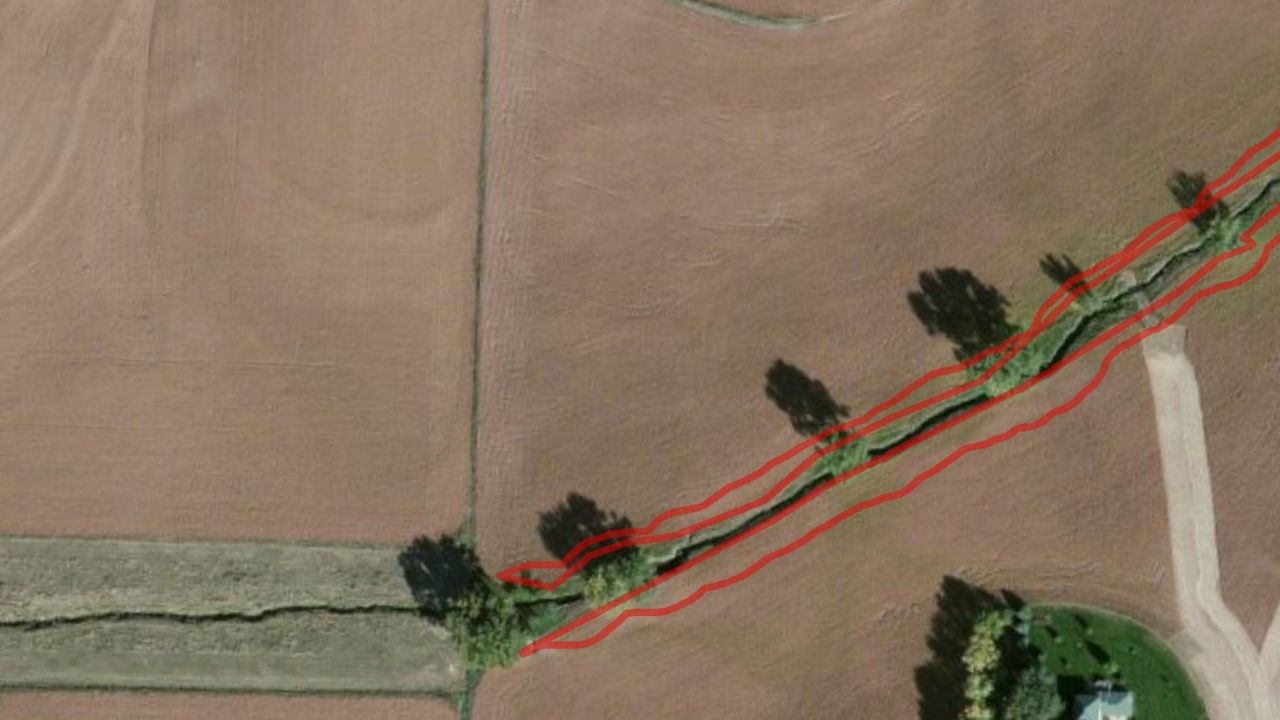
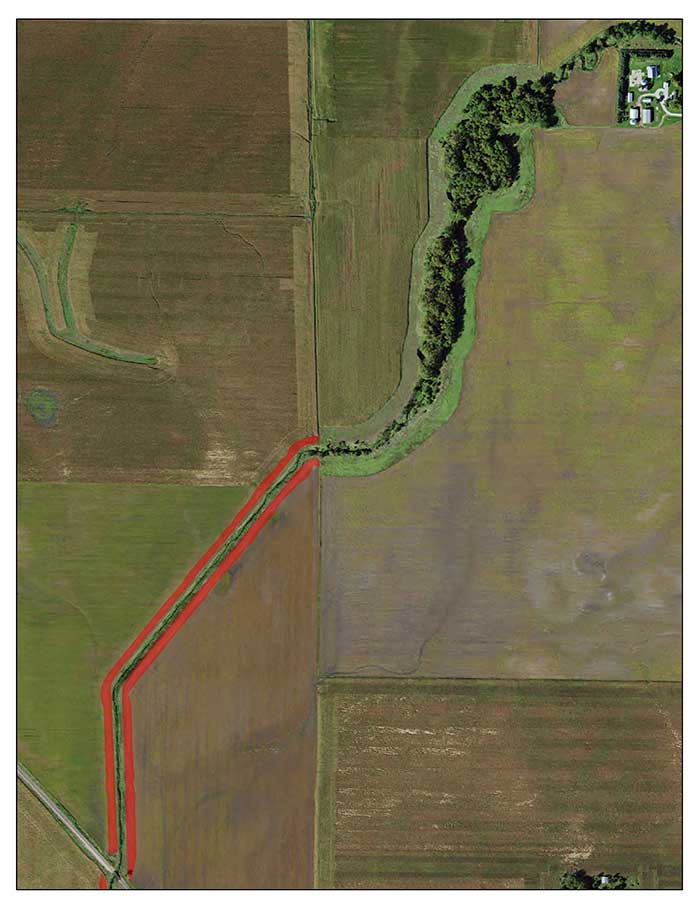
Even between adjacent fields there are big differences in how well streams are protected. Often streamside buffers appear and disappear at property lines (Figure 3).
Figure 3: Big differences between streamside buffers on adjacent fields.
See for yourself by clicking on a county below.
Source: National Agricultural Imagery Program, 2014.
Converting a Tiny Fraction of Crop Acres Would Meet Standards
In all five counties, the number of acres that would have to be planted with grass to comply with a streamside buffer standard is a vanishingly small percentage of the acreage currently planted with corn and soybeans (Table 3). The percent of corn and soybean acres needed to meet the 35-foot standard ranges from 0.03 percent in Allamakee, Hamilton, Linn and Union counties to 0.08 percent in Plymouth County. That amounts to a miniscule 565 acres of row crops that would need to be planted with grass across all five counties – 0.05 percent of all corn and soybean acres. Remarkably, even a 50-foot buffer standard would require less than 1,500 acres in total across all five counties – 0.12 percent of the land planted with row crops.
Table 3: Very few acres of corn and soy would need to be planted with grass.
| County | 2013 corn and soy acres | Acres Needed to Meet Standard | Percent of Total Corn and Soy Acres Needed to Meet Standard | ||||
|---|---|---|---|---|---|---|---|
| 35-foot | 50-foot | 75-foot | 35-foot | 50-foot | 75-foot | ||
| Allamakee | 89,502 | 23 | 79 | 288 | 0.03% | 0.09% | 0.32% |
| Hamilton | 301,683 | 81 | 164 | 457 | 0.03% | 0.05% | 0.15% |
| Linn | 245,438 | 72 | 183 | 455 | 0.03% | 0.07% | 0.19% |
| Plymouth | 402,304 | 338 | 793 | 1,813 | 0.08% | 0.20% | 0.45% |
| Union | 179,103 | 51 | 212 | 509 | 0.03% | 0.12% | 0.28% |
| Grand Total | 1,218,028 | 565 | 1,430 | 3,522 | 0.05% | 0.12% | 0.29% |
In Hamilton County, meeting even the 75-foot streamside buffer standard would require converting only 0.15 percent of corn and soybean acres to grass. Meeting that standard in Plymouth County – the county that lacks the most streamside buffers – would take out only 0.45 percent of row crop acres. Meeting the 75-foot standard in all five counties would require 3,522 acres – 0.29 percent of the total corn and soybean acreage.
Most Landowners Would Not Be Affected
Meeting streamside buffer standards for all the waterways EWG assessed would affect only a small percentage of landowners in the five counties. Even implementing a 75-foot standard would affect only 13 percent of landowners (Table 4). Meeting a 35-foot standard would affect only 8 percent.
Table 4: Percent of landowners affected by each possible standard
| County | Percent of all landowners affected | Percent of landowners with cropland along streams affected | ||||
|---|---|---|---|---|---|---|
| 35-foot | 50-foot | 75-foot | 35-foot | 50-foot | 75-foot | |
| Plymouth | 13% | 15% | 17% | 67% | 77% | 86% |
| Linn | 6% | 8% | 10% | 22% | 33% | 42% |
| Hamilton | 6% | 8% | 10% | 27% | 36% | 46% |
| Union | 9% | 13% | 16% | 31% | 45% | 57% |
| Allamakee | 4% | 8% | 11% | 18% | 35% | 45% |
| Total | 8% | 11% | 13% | 34% | 46% | 56% |
Of course, a buffer standard would affect a larger percentage of those landowners who actually own cropland adjacent to streams and rivers, ranging from 34 percent to meet a 35-foot standard to 56 percent to meet a 75-foot standard. Far more Plymouth County streamside landowners would be affected, reflecting the poor state of current streamside buffers in that county.
Even more striking, fully 85 percent of all affected landowners across all five counties would need to convert only an acre or less of cropland to meet the 35-foot standard (Table 5). Converting a single acre or less would enable 71 percent of landowners to meet a 50-foot standard and 54 percent to meet a 75-foot requirement. The average landowner in EWG’s analysis controlled more than 125 acres.
Table 5. Percentage of unique owners who could meet each standard by converting a given number of acres
| Additional Streamside Buffer Acres Needed to Meet Each Standard | 35 ft. | 50 ft. | 75 ft. |
|---|---|---|---|
| 0.01-0.25 acres | 56% | 43% | 27% |
| 0.26-0.5 acres | 13% | 14% | 13% |
| 0.51-1 acres | 16% | 14% | 14% |
| 1.01-2 acres | 10% | 15% | 14% |
| 2.01-3 acres | 3% | 7% | 10% |
| 3.01-4 acres | 1% | 3% | 7% |
| 4.01-5 acres | 0% | 2% | 4% |
| more than 5 acres | 0% | 2% | 10% |
Conclusion
EWG’s assessment of streamside buffers in this five-county sample shows that enacting and implementing a streamside buffer standard would be a simple but very effective way to make significant progress toward meeting the goals of the Iowa Nutrient Reduction Strategy. A streamside buffer standard would put Iowa on course to finally clean up its far too dirty rivers and streams.
Moreover, a streamside buffer standard would require converting a vanishingly small number of acres to grass strips in the counties assessed. Individual landowners’ investment of land would be very small as well. The vast majority of landowners wouldn’t be affected at all.
Enacting a streamside buffer standard poses the most important policy issue facing Iowans who are tired of dirty water – what is fair to expect landowners to do at their own cost as part of the responsibilities that come with ownership.
If Iowa is serious about cleaning up its water, a streamside buffer standard of at least 50 feet would be an excellent place to start. Even in the absence of state action, Iowa counties could take the initiative to protect their waterways on their own.