The Environmental Working Group presents an innovative “Water Atlas” tracking phosphorous and nitrate pollution in four Upper Mississippi River Basin states.
Through two interactive maps, the water atlas provides detailed information, parsed from over 189,000 public records from more than 8,200 state and federal water monitors, about phosphorus and nitrate pollution in surface water and groundwater, as well as nitrate in the drinking water provided by 3,794 community water systems in Illinois, Iowa, Minnesota and Wisconsin.
It also highlights the extent to which fertilizer and/or manure is applied to cropland in each county, revealing a close correlation between intensive fertilization and high levels of phosphorus and nitrates in water resources that put recreation, aquatic life and drinking water at risk.
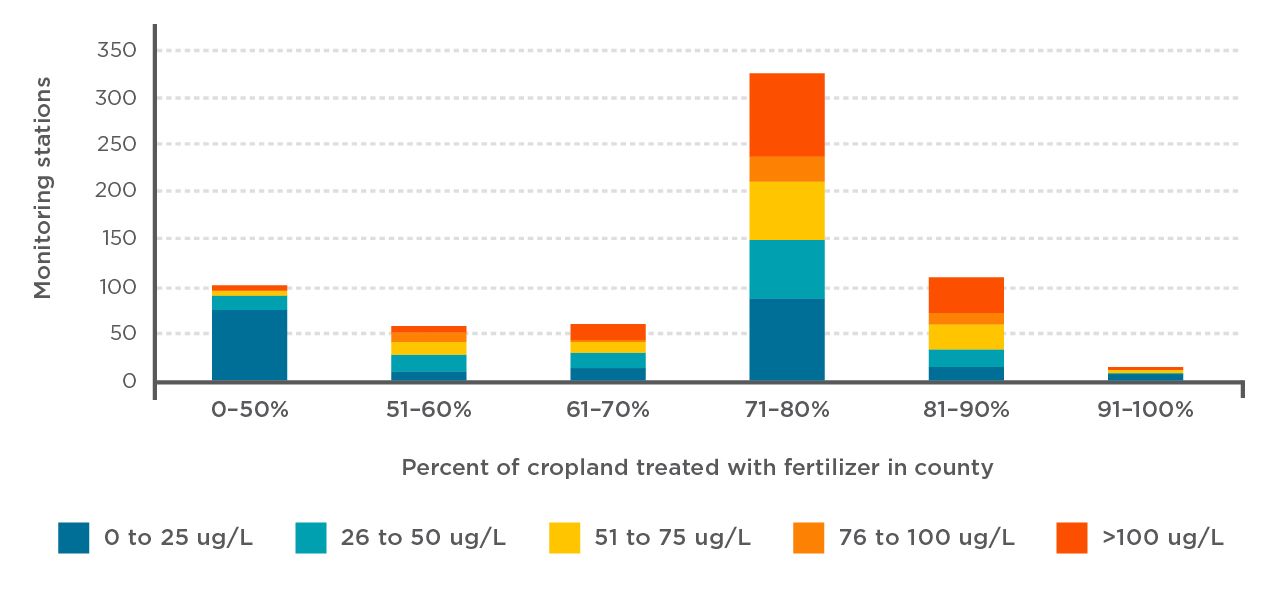
Eighty-six percent of the communities with drinking water contaminated with nitrate at half or more of the federal legal limit – 10 milligrams per liter, or mg/L – are in counties where at least 70 percent of the cropland is fertilized. A total of 80 percent of surface water monitoring stations with high levels of phosphorus – those greater than 100 micrograms per liter, or ug/L – are in such counties.
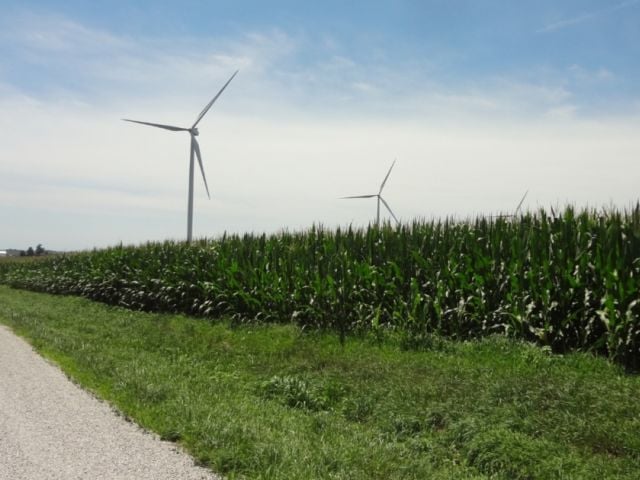
Fertilizer and manure applied on agricultural lands is the primary source of nutrient pollution in the Upper Mississippi River Basin. Unless carefully managed, excess phosphorus and nitrate run off fields into streams, rivers and lakes or seep through the soil into groundwater, threatening public health and the environment.
Nitrogen and phosphorus runoff from agriculture in the Mississippi River Basin – much of it in the four states covered by EWG’s water atlas – also causes a notorious annual hypoxic zone off the coast of Louisiana and Texas. During the summer, that part of the Gulf of Mexico is effectively dead, with devastating effects for Gulf fisheries and the environment.
As EWG’s water atlas shows, the scale of the pollution problem across Illinois, Iowa, Minnesota and Wisconsin makes it impossible to meaningfully address the consequences of the problem without reducing runoff from agricultural lands.
Phosphorus overload
The water atlas reveals widespread and alarming levels of phosphorus pollution in rivers, lakes, streams and groundwater. Nitrate contamination of drinking water is receiving long overdue attention from scientists, policy makers and public health advocates for its adverse impacts, and now the water atlas underlines the urgent need to apply the same scrutiny to the problem of phosphorus pollution.
Excessive levels of phosphorus in freshwater encourage the growth of “blue-green algae” – actually tiny organisms called cyanobacteria – which can be harmful to humans and animals when they turn toxic. And even algae outbreaks that are not toxic foul lakes, rivers and streams, making them unfit for fishing and swimming.
Out of the four Upper Mississippi River Basin states included in EWG's water atlas, only Minnesota and Wisconsin have established numeric criteria for phosphorus, which are EPA-approved standards meant to protect water resources from high levels of the chemical.
In Minnesota, the phosphorus criteria range from 50 ug/L for northern streams to 150 ug/L for southern streams. Wisconsin has a similar scale, based on stream classification, ranging from 75 to 100 ug/L. In both states, the lake criteria are lower, ranging from 12 to 90 ug/L in Minnesota and from 15 to 40 ug/L in Wisconsin.
In 2019, Wisconsin streams averaged 211 ug/L phosphorus, while Minnesota streams averaged 125 ug/L. Iowa’s rivers and streams had the highest average phosphorus levels (339 ug/L), followed by Illinois (280 ug/L). Lakes in Illinois had the highest average phosphorus detection (212 ug/L), followed by Iowa (117 ug/L), Wisconsin (40 ug/L) and Minnesota (25 ug/L).
Groundwater in the four states is also polluted with high levels of phosphorus, which can increase phosphorus levels in nearby surface water. Across all four water atlas states, phosphorus detections in 672 groundwater samples averaged 101 ug/L between 2012 and 2019. Wisconsin's average (420 ug/L) was over four times this amount – far above surface water standards – followed by Iowa (139 ug/L), Illinois (122 ug/L) and Minnesota (48 ug/L).
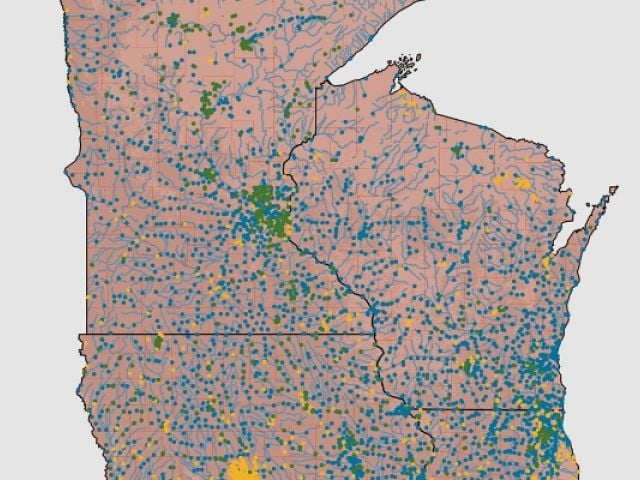
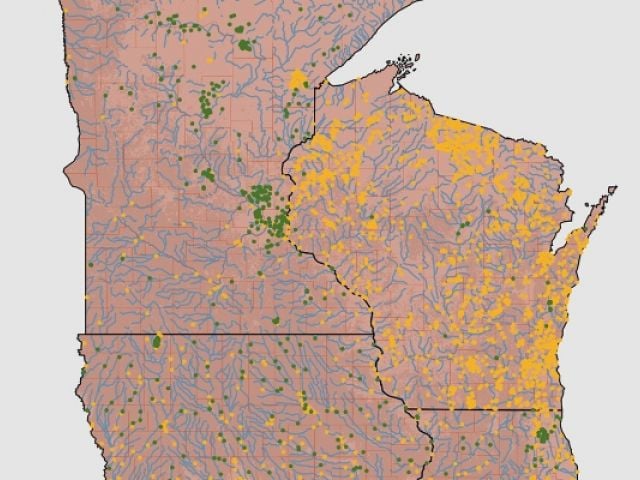
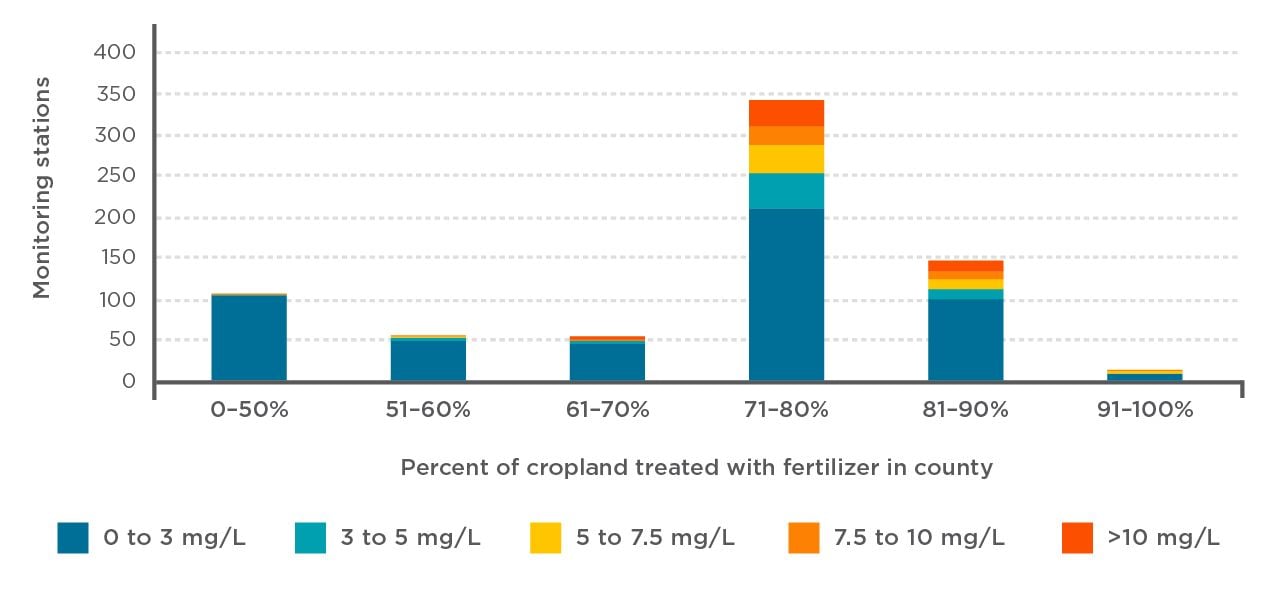
Phosphorus overloading in both surface water and in groundwater is closely linked to how much cropland in the county is getting fertilizer every year. A total of 80 percent of the surface water monitoring stations and 83 percent of groundwater stations with seriously elevated phosphorus levels (100 ug/L or more) are in counties where more than 70 percent of the cropland is fertilized (Figures 1 and 2).
Figure 1: Correlation between intensive fertilization and high levels of phosphorus in surface water.
Figure 2: Correlation between intensive fertilization and high levels of phosphorus in groundwater.
Nitrate contamination in drinking water
Previous EWG investigations have revealed that nitrate contamination of drinking water is a serious and worsening problem in the region and across the United States, and the water atlas’ findings underscore this urgent issue.
The water atlas compiles community water system nitrate testing data from more than 3,700 public water systems serving over 19 million people in Illinois, Iowa, Minnesota and Wisconsin between 2012 and 2019. This data confirms widespread nitrate contamination of drinking water at levels associated with increased health risks.
Nine out of 10 of the community water systems in the four states use groundwater as their source and serve over 9.6 million people. Fewer systems rely primarily on surface water, but they serve 9.4 million people.
Under the 1974 federal Safe Drinking Water Act, the legal limit for nitrate (measured as nitrogen) in community water systems is 10 mg/L, which is enforced by the Environmental Protection Agency. This limit was based on a 1962 U.S. Public Health Service recommendation to guard against so-called blue baby syndrome, a potentially fatal condition where infants who ingest too much nitrate are starved of oxygen. But more recent studies show strong evidence of an increased risk of colon and rectal cancers, thyroid disease and neural tube birth defects at levels of 5 mg/L or even lower.
More than 2.8 million people are served by water systems that tested at or above 5 mg/L at least once over the eight-year period. One out of every 400 water systems detected nitrate at or above 10 mg/L at least once. These systems serve more than 490,000 people, with 32 percent of them in Minnesota and 29 percent in Iowa, followed by Wisconsin (22 percent) and Illinois (17 percent).
Millions of people in the four states rely on private wells that draw water from the ground for drinking. EWG has documented alarming contamination of those household wells in Iowa and Minnesota, but there is no systematic monitoring of private wells across the region.
The water atlas includes nitrate testing from the limited number of groundwater monitoring stations in the region with publicly available data. Of those stations, 138 found nitrate at or above 5 mg/L and 49 found nitrate at or above 10 mg/L.
Nitrate contamination of drinking water and groundwater are closely linked to the amount of cropland receiving fertilizer. A total of 86 percent of the community water systems with average nitrate contamination at or above 5 mg/L are in counties where more than 70 percent of the cropland is fertilized (Figure 3). Fully 94 percent of groundwater monitoring stations are in counties where more than 70 percent of the cropland is fertilized (Figure 4).
Figure 3: Correlation between intensive fertilization and high levels of nitrate in drinking water.
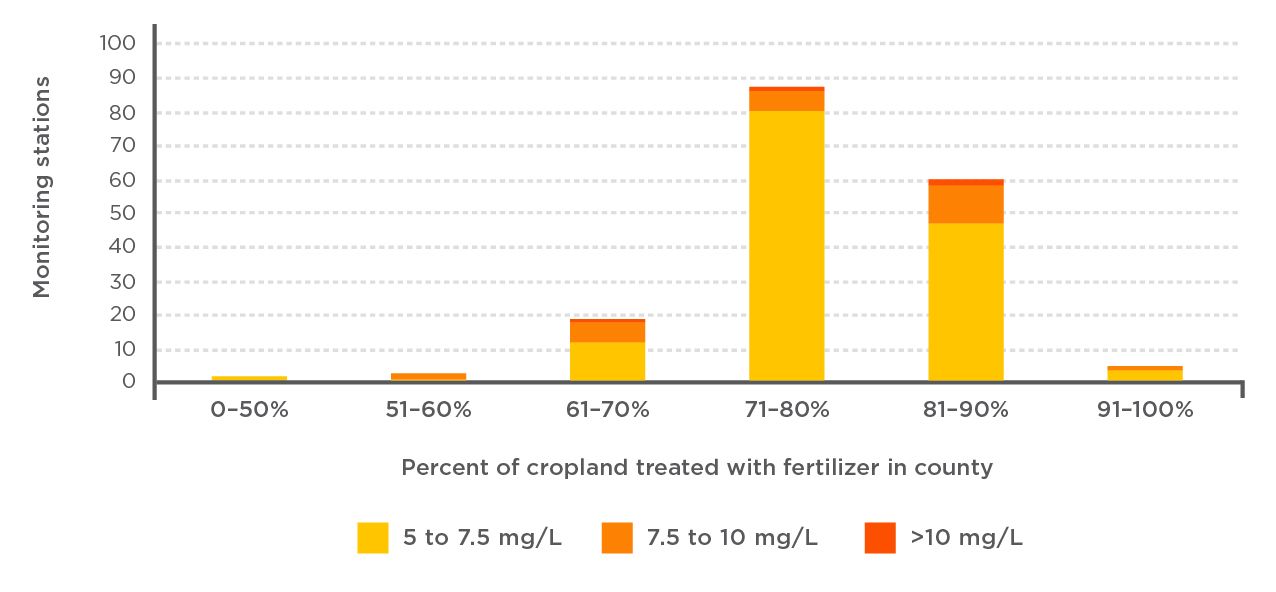
Figure 4: Correlation between intensive fertilization and high levels of nitrate in groundwater.
About the data
There are multiple ways to measure and report levels of phosphorus and nitrate in surface water and groundwater. How those levels are reported often differ among, and even within, states. EWG used the best available data sources to build the water atlas, aiming for as much consistency between states as possible to effectively compare the contamination (Figure 5).
Figure 5: Data used to create the water atlas
|
Resource |
Agency |
Nitrogen characteristic |
Phosphorus characteristic |
|
Drinking water |
USEPA Safe Drinking Water Information System (SDWIS) |
Nitrate as N |
N/A |
|
Groundwater |
USGS, Iowa DNR, Wisconsin DNR, Minnesota DNR and Illinois State Water Survey |
Total nitrate, Dissolved nitrate |
Total phosphorus, Dissolved phosphorus, Total phosphorus-phosphate |
|
Surface water |
USGS, EPA |
Total nitrate, Dissolved nitrate |
Total phosphorus, Total phosphorus-phosphate |