Taxpayers Guarantee Central Valley Farms Water Through a Subsidy Worth Up to $416 Million per Year
At a time when California water is scarce and expensive, taxpayers guarantee Central Valley farms an abundant and cheap supply through a subsidy worth up to $416 million a year, according to an Environmental Working Group (EWG) investigation that calculated, for the first time, federal water subsidies to each of more than 6,800 farms in the Central Valley Project (CVP).
The study, which comes as the U.S. Bureau of Reclamation is negotiating new long-term contracts with CVP farmers, is the first to name individual recipients of federal water subsidies in California. It confirms that large agribusiness operations — not the small family farmers federal water projects were intended to benefit — are reaping a windfall from taxpayer-subsidized cheap water.
EWG found that water subsidies in the CVP are overwhelmingly controlled by the largest farms. In 2002, the largest 10 percent of the farms got 67 percent of the water, for an average subsidy worth up to $349,000 each at market rates for replacement water. Twenty-seven large farms received subsidies each worth $1 million or more at market rates, compared to a median subsidy for all recipients of $7,076. One farm — Woolf Enterprises of Huron, Fresno County — received more water by itself than 70 CVP water user districts, for a subsidy worth up to $4.2 million at market rates.
CVP farmers get about one-fifth of all the water used in California, at rates that by any measure are far below market value. In 2002, the average price for irrigation water from the CVP was less than 2 percent what Los Angeles residents pay for drinking water, one-tenth the estimated cost of replacement water supplies, and about one-eighth what the public pays to buy its own water back to restore the San Francisco Bay and Delta.
Water districts' records of individual recipients of CVP subsidies are shielded from the public by state law. But EWG's 16-month investigation used data from the federal Bureau of Reclamation, the state Department of Water Resources and the state Department of Pesticide Regulation to answer fundamental questions that have stymied efforts at reform of the CVP: Who gets subsidized water, how much do they get, and what is each recipient's water subsidy worth?
We sought the answers because the public has a right to know where its water is going. The public, elected officials and regulatory agencies need this information in order to make informed decisions about the future use of California's most valuable natural resource. The federal Bureau of Reclamation is in the midst of negotiating new long-term contracts with CVP water recipients, and its decisions will lock up millions of acre-feet of water for the next half a century.
The original intent of federal water projects, set out in the Reclamation Act of 1902, was to encourage Western settlement by small family farms. Today, artificially cheap irrigation water in the Central Valley has led to a host of problems, including the inefficient use of water, devastation of fish and wildlife habitat and severe toxic pollution. Thousands of Californians — including Central Valley residents employed by farms whose water is subsidized — lack access to an affordable and pure supply of drinking water.
Reforms to make details of water subsidies public, limit the amount and value of water subsidies to large farms, and encourage conservation by pricing water at rates closer to market value are needed to end the disaster for taxpayers and the environment wrought by the Central Valley Project.
It's one thing to ask taxpayers to subsidize farming with cheap water. It's another thing when those subsidies top $400 million a year, and still another when the great majority of the subsidies are going to the largest, wealthiest farms. As the contracts governing these subsidies are renegotiated, it's time for an honest and fully informed debate about how the water needs of all Californians will be met in the 21st Century.
Findings
At a time when California water is scarce and expensive, taxpayers guarantee Central Valley farms an abundant and cheap supply through a subsidy worth $416 million a year or more, according to an Environmental Working Group (EWG) investigation that calculated, for the first time, federal water subsidies to each of more than 6,800 farms in the Central Valley Project (CVP).
These findings come as the U.S. Bureau of Reclamation is negotiating new long-term contracts with CVP farmers that will lock up millions of acre-feet of California's most precious resource for 50 years. EWG's investigation is the first to name individual recipients of federal water subsidies in California — a missing detail that has stymied repeated efforts at reform of the largest federal water project in the nation. It confirms what has long been suspected: Multimillion-dollar agribusiness operations — not the small family farmers whom federal water projects were originally intended to benefit — are reaping a windfall from taxpayer-subsidized cheap water while Californians face recurring water shortages and higher water bills.
Although there are more than 6,800 farms in the CVP, EWG found that water subsidies are overwhelmingly concentrated in the hands of the largest farms:
- In 2002, the top 10 percent of CVP farms in terms of total water use got 67 percent of all the irrigation water delivered by the CVP. Those 683 farms received an average of 2,300 acre-feet, for an average subsidy worth up to $349,000 at the market rate for replacement water. (a) (Unless noted, this market rate for replacement water was used to define the subsidies listed in this report and database; the actual subsidy at this rate could be twice as high as our estimates.)
- The top 5 percent, or 341 farms, got 49 percent of the irrigation water. On average, these farms received an estimated 3,400 acre-feet of water, for a subsidy worth up to $513,000. This is enough water to supply 2.3 million households for a year.
- The 25 largest farms accounted for more than 13 percent of CVP irrigation water, receiving on average an estimated 11,900 acre-feet of water, for an average subsidy worth up to $1.7 million. 27 farms received subsidies worth up to $1 million each. A single farm, Woolf Enterprises of Huron, Fresno County, received 29,000 acre-feet, for a one-year subsidy worth up to $4.2 million at market rates.
- Meanwhile, the average farm received only 350 acre-feet of water, for a median subsidy of $7,056. More than 90 percent of CVP farmers got less than 1,000 acre-feet of water in 2002. (The average US household uses less than one half of one acre-foot each year.)
What's the water worth?
Analysis of federal, state and local data shows that about one-fifth of all agricultural water in California goes to CVP farmers at rates that, by any measure, are far below market value:
- In 2002, the average price paid for irrigation water from the CVP was less than 2 percent of what residents of Los Angeles pay for drinking water, and less than 3 percent of what residents of San Francisco pay.
- The average CVP price is one-tenth the estimated cost of replacement water supplies from proposed new dams and reservoirs.
- The average CVP price is about one-eighth what the public pays to buy its own water back from the CVP to restore fish and wildlife habitat in the San Francisco Bay and Delta — an ecosystem severely degraded by the diversion of water to agriculture and the resulting toxic pollution.
Source: [11,15,16,17,18]
EWG's 16-month investigation unearthed data from the Federal Bureau of Reclamation, the state Departments of Water Resources and Pesticide Regulation — much of it obtained through federal Freedom of Information Act and California Public Records Act requests. We sought answers to the most fundamental questions about one of the largest and longest-running government subsidies to any industry in any state:
- Who gets subsidized water?
- How much do they get?
- What is each recipient's water subsidy worth?
The Central Valley Project, built starting in 1936, is the largest water storage and delivery system in California and the largest federal water project in the country. Each year it carries 7 to 8 million acre-feet of water — 2.3 to 2.6 billion gallons. Ninety percent is used to irrigate crops. [1, 2]
Water belongs to us all
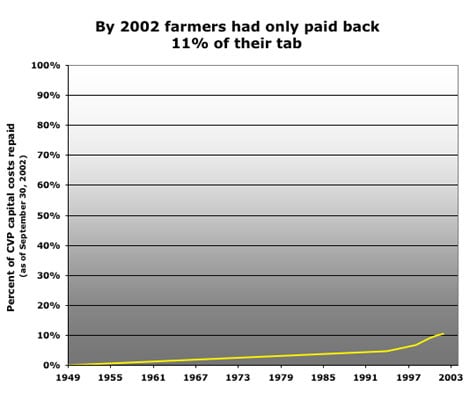
Although many CVP farmers may consider it theirs, according to the state Constitution the water, which originates as snow in the Sierra Nevada, belongs to the people of California. (b) Likewise, the Project's infrastructure — 20 dams and reservoirs, more than 1,600 miles of canals and drains — was paid for by federal taxpayers, at a cost of $3.6 billion. Under the law creating the CVP, recipients are supposed to repay this capital cost. By 2002, 60 years after the water started flowing, irrigators had repaid only 11 percent of their allocated cost. At the current pace, this interest-free loan won't be paid off for another 100 years. There are still other hidden subsidies that add up to millions of dollars over time. (See "About the CVP.")
But the details of this massive corporate welfare program are hidden from the public — by state law.
Water and irrigation districts are defined as utilities, which under the state Public Records Act, are not required to release information about their customers (following a case during the state's early-90s drought in which The New York Times sought the names of water users exceeding their allotted ration of water.) [Read legal opinion PDF] Today, some CVP water districts do not even maintain internal records of how much water individual farmers receive. Accurate information on individual recipients is also hidden by the widespread legal maneuver of dividing large farms into many smaller farms, to get around the rule that no one may get subsidized water for more than 960 acres. (c)
But the public has a right to know where its water is going, and whether recipients are paying their fair share in a time of increasing cost and scarcity. What's more, the public, elected officials and regulatory agencies need this information now in order to make informed decisions about the future use of California water. Virtually every study of the CVP, from academic, government and non-profit sources, has concluded that the subsidy system is an economic and environmental disaster — yet the stage is set to perpetuate the disaster for another 50 years. [5, 6, 7, 8, 9]
The Bureau of Reclamation is in the midst of negotiating new long-term contracts with CVP water recipients. Some may be finalized before the end of 2004; others are scheduled for completion in 2005 and beyond. Nearly all the contracts are not with individual farmers, but with the water districts, who pass the water they receive — and the subsidies — along to their members. The new contracts are for 25 years, but many provide for automatic renewal, so that the Bureau's decisions in coming months will have a major impact on California water supply for the next half a century. [8]
According to Rep. George Miller of California, former chair of the House Natural Resources Committee, the Bureau of Reclamation has failed "to allow for adequate public participation, review and comment in the development of the long-awaited and very important contracts." Miller and several other Members of Congress have repeatedly petitioned the Bureau of Reclamation to re-open public comment periods after the long-term environmental and fiscal effects of the contracts were made known. Miller author of a law that sought to reform the CVP — with mixed results because of entrenched resistance to change by recipients, the Bureau and members of Congress from the Central Valley and other agricultural regions — wrote last year:
When the expiring contracts were signed in the 1960s, California was a very different place than it is today. California's population has more than tripled in the last 50 years. The Central Valley . . . has lost a half-million acres of farmland to urbanization in the last 20 years alone, and the Valley's non-farm population will more than double by 2040. Land is also being voluntarily retired because of severe pollution contamination related to irrigation. What farming remains will have to maximize water conservation and minimize runoff degradation. . . . If new contracts ignore decades of changed conditions in California, it will take years of litigation and probably billions of public dollars in buyouts to extricate ourselves and allow us to allocate water in conformity with California's true needs. [10]
The Bureau of Reclamation's figures for the total amount of water delivered through the CVP are public. EWG used those figures and state data on farm size and the water needs of different crops to calculate the value of the water subsidy for almost all districts in the CVP and make the most accurate estimates possible for the value of the subsidy for each farm in those districts. (For details see "Methodology.") If water districts or individual recipients take issue with our estimates, they are free to make their records public.
EWG calculated that, depending on how the market value of the water is defined, CVP farmers are receiving between $60 million and $416 million in water subsidies each year. The first figure represents the subsidy if the water is priced at the Bureau of Reclamation's so-called "full cost rate," which in practice is much less than the actual full cost of delivering water to recipients. [3] The higher figure comes from comparing the average price for CVP water to the estimated cost of replacement water supplies from proposed dams and reservoirs on the San Joaquin River. An intermediate figure is $305 million a year, reflecting the difference between the average CVP rate and the price paid for CVP water by the Environmental Water Account, a state-federal joint agency, to restore fish and wildlife habitat in the Bay-Delta.
No matter what market value is used for comparison, the total subsidy to CVP farmers exceeds the actual amount they paid in 2002, about $48 million. [11] That means CVP water users are getting a minimum discount of 55 percent below market value, ranging up to almost 90 percent, for the water they receive.
Table: Water subsidies for the entire CVP.
| Amount of CVP water purchased in 2002 (acre-feet) | Amount paid to the Bureau of Reclamation | Subsidy* calculated at | ||
|---|---|---|---|---|
|
Federal "full cost" rate |
State Environmental Water Account rate |
Replacement Water Rate |
||
| 2,722,574 | $47,700,570 | $59,682,672 | $304,818,312 | $416,280,491 |
Source: [11]
*The three figures listed here are the subsidy amounts — that is, the difference between what the water user should have paid for the water minus what they actually paid.
Unlike federal crop subsidies, for which the recipient simply gets a check, the value of water subsidies depends on two variables — the amount of water received and the amount paid. Lots of water at very cheap rates means big subsidies. Lots of water at closer to market rates means lower subsidies.
Concentration of subsidies
But as with crop subsidies, we found that water subsidy distribution is highly uneven within the CVP. Some districts get hardly any water subsidies while others are awash in cheap federal water. In 2002, the CVP delivered 2.7 million acre-feet of water (d) to more than 90 different water districts, but just 10 districts accounted for 60 percent of the water delivered and subsidies received. [11]
One district skews the balance all by itself: Westlands Water District, one of the most powerful forces in California agriculture and politics. Westlands, encompassing more than 600,000 acres in Fresno and Kings counties, receives more than a quarter of all irrigation water delivered by the CVP. Depending on how the market value of the water is calculated, Westlands receives 26 percent to 40 percent of all of water subsidies in the CVP — between $24 million and $110 million a year.
It is important to note that EWG's subsidies estimates are well within the bounds of other estimates. For example, the prominent UC Berkeley economist David Sunding testified before the House Subcommittee on Water and Power in 2001 that "the present value of the [water] subsidy to Westlands alone is nearly $1 million per farmer." [28]
Table: Top 10 water district subsidy recipients
|
Water District |
Amount of CVP water purchased in 2002 (acre-feet) |
Amount paid to the Bureau of Reclamation |
Subsidy* calculated at |
||
|---|---|---|---|---|---|
|
Federal "full cost" rate |
State Environmental Water Account rate |
Replacement Water Rate |
|||
|
Westlands Water District |
721,258 |
$13,407,763 |
$23,908,128 |
$79,980,723 |
$109,509,025 |
|
Madera Irrigation District |
130,154 |
$2,313,491 |
$1,464,762 |
$14,538,849 |
$19,867,354 |
|
Delano-Earlimart Irrigation District |
125,156 |
$2,377,714 |
$1,463,908 |
$13,827,485 |
$18,951,371 |
|
Lower Tule River Irrigation District |
112,727 |
$1,988,040 |
$1,202,792 |
$12,607,852 |
$17,222,896 |
|
So San Joaquin Municipal Utility District |
105,549 |
$2,067,216 |
$1,184,911 |
$11,599,268 |
$15,920,444 |
|
Sutter Municipal Water Company |
105,391 |
$500,467 |
$1,735,930 |
$13,145,559 |
$17,460,267 |
|
Chowchilla Water District |
93,611 |
$1,578,419 |
$954,100 |
$10,542,333 |
$14,374,767 |
|
Del Puerto Water District |
90,693 |
$1,891,563 |
$1,107,654 |
$9,851,366 |
$13,564,338 |
|
Glenn-Colusa Irrigation District |
90,207 |
$306,974 |
$1,688,405 |
$11,373,028 |
$15,066,103 |
|
Panoche Water District |
63,637 |
$995,620 |
$1,257,821 |
$7,244,099 |
$9,849,397 |
Source: [11]
*The three figures listed here are the subsidy amounts — that is, the difference between what the water user should have paid for the water minus what they actually paid.
In terms of individual water subsidy recipients, Westlands again gets the lion's share. Of the 9 farms that used the most Project water in 2002, all are wholly or partly contained within Westlands. Each of these farms used an estimated 13,000 to 29,000 acre-feet of CVP water and received subsidies reaching into the millions of dollars.
Westlands is also home to one farm that is by far the single largest recipient of CVP water: Woolf Enterprises, with headquarters in Huron in western Fresno County. This farm uses its subsidized water to grow thousands of acres of tomatoes, cotton, almonds, garlic and pistachios, among other crops. According to EWG's estimates, Woolf Enterprises used a staggering 29,000 acre-feet of water in 2002 — 50 percent more water than any other single farm in the CVP. This is enough water to fill more than 37,000 Olympic-sized swimming pools, and is more water than used by 70 entire water districts in 2002.
Table: The 27 farmers getting $1 million in subsidies or more
|
Farm name |
Estimated amount of CVP water purchased in 2002 (acre-feet) |
Subsidy* calculated at |
||
|---|---|---|---|---|
|
Federal "full cost" rate |
State Environmental Water Account rate |
Replacement Water Rate |
||
| Woolf Enterprises | 29,000 | $38,000 to $710,000 | $2.3-3.0 million | $3.5-4.2 million |
| Dresick Farms Inc. | 19,000 | $30,000 to $450,000 | $1.5-1.9 million | $2.3-2.7 million |
| Burford Ranch | 17,000 | $31,000 to $420,000 | $1.4-1.8 million | $2.1-2.5 million |
| Vaquero Farms | 17,000 | $38,000 to $410,000 | $1.4-1.7 million | $2.1-2.4 million |
| S & S Ranch | 16,000 | $29,000 to $390,000 | $1.3-1.7 million | $2.0-2.3 million |
| Harris Farms | 15,000 | $36,000 to $370,000 | $1.2-1.5 million | $1.8-2.2 million |
| Murrieta Westland Trust | 14,000 | $39,000 to $340,000 | $1.1-1.4 million | $1.7-2.0 million |
| Tanimura & Antle | 13,000 | $29,000 to $310,000 | $1.0-1.3 million | $1.6-1.8 million |
| O'Neill Farming Enterprises | 13,000 | $36,000 to $310,000 | $1.0-1.3 million | $1.5-1.8 million |
| Davis, O/et al | 11,000 | $120,000 | $1.3 million | $1.7 million |
| Westside Harvesting LP (North) | 11,000 | $37,000 to $270,000 | $910,000 to $1.1 million | $1.4-1.6 million |
| Stone Land Company | 11,000 | $34,000 to $260,000 | $870,000 to $1.1 million | $1.3-1.5 million |
| Anderson, Dick & Sons Farming | 10,000 | $33,000 to $240,000 | $820,000 to $1.0 million | $1.2-1.4 million |
| Schreiner Farms | 9,900 | $36,000 to $190,000 | $1.1-1.3 million | $1.5-1.7 million |
| Christopher Ranch, L.L.C. | 9,500 | $32,000 to $170,000 | $860,000 to $1.0 million | $1.2-1.4 million |
| Perez Farms | 9,400 | $35,000 to $110,000 | $940,000 | $1.3-1.4 million |
| Sutter Basic Corp | 9,100 | $66,000 to $210,000 | $1.0-1.2 million | $1.4-1.5 million |
| Borba Brothers Farms | 8,800 | $39,000 to $210,000 | $730,000 to $900,000 | $1.1-1.3 million |
| Terra Linda Farms II | 8,700 | $34,000 to $210,000 | $710,000 to $880,000 | $1.1-1.2 million |
| Westside Harvesting LP | 8,600 | $38,000 to $210,000 | $700,000 to $870,000 | $1.1-1.2 million |
| Paramount Citrus | 8,200 | $13,000 to $94,000 | $820,000 | $1.1-1.2 million |
| Fordel Inc. | 7,900 | $20,000 to $220,000 | $640,000 to $850,000 | $960,000 to $1.2 million |
| Vann Bros. | 7,400 | $32,000 to $210,000 | $700,000 to $880,000 | $1.0-1.2 million |
| Hammond Ranch | 7,200 | $29,000 to $93,000 | $710,000 | $1.0-1.1 million |
| Delmar Farms | 7,200 | $31,000 to $98,000 | $700,000 | $1.0 million |
| Quad H Ranches/Hoffart Farms | 7,200 | $39,000 to $140,000 | $820,000 to $920,000 | $1.1-1.2 million |
| Richter Brothers | 6,500 | $32,000 to $120,000 | $730,000 to $820,000 | $1.0 million |
| Baker Farming | 7,100 | $32,000 to $190,000 | $580,000 to $740,000 | $870,000 to $1.0 million |
*The three figures listed here are the subsidy amounts — that is, the difference between what the water user should have paid for the water minus what they actually paid.
What is clear is that artificially cheap water creates an uneven playing field. Farmers in the State Water Project, a much smaller system that parallels the CVP in some areas, pay almost three times on average for water than farmers in the CVP. Providing a relative handful of large farmers with highly subsidized water tends to concentrate landholdings into fewer and fewer hands. A 1986 study by the California Institute for Rural Studies found that Central Valley farms receiving federally subsidized water are 7.2 times larger on average than farms not receiving subsidized water. [12]
Consequences
Defenders of federally subsidized water projects in the West argue that they "made the desert bloom" (another way of saying that they make it possible to grow crops that are neither economically nor environmentally sustainable). Farms in the CVP produce roughly $3 billion worth of crops a year. [2]
But the original intent of federal water projects, set out in the Reclamation Act of 1902, was to encourage Western settlement by small family farms. Initially, no one could receive subsidized water for more than 160 acres, and they had to live on the land. [3] Today, artificially cheap irrigation water in the Central Valley has led to a host of problems besides the CVP-sized hole in the federal treasury. Among the most serious:
- By allowing the planting of water-intensive crops such as rice, cotton and alfalfa in what is naturally a desert, it has discouraged the efficient use of water. While the average acre of U.S. farmland gets 2.48 acre-feet of water each year, the average acre in California gets 36 percent more, or 3.37 acre-feet. [13] In a state where water demand for all uses exceeds supply by 1.6 million acre-feet in normal years and 5.1 million acre-feet in drought years, this is irresponsible. [14] As urban customers are often reminded, there's never enough water to waste.
- This inefficiency means less water for wildlife and urban users. Wildlife in particular has paid the price. Of 29 fish species native to the Sacramento and San Joaquin Rivers and the Bay-Delta, two are extinct, six are endangered, five are rare, and nine others are declining. [2]
- Cheap water has also made feasible the continued farming of land unsuited for irrigation because of serious drainage and toxicity problems. One of the worst environmental disasters in the state's history, the mass death of migratory birds at the Kesterson National Wildlife Refuge in Merced County, was the result of toxic salts in the soil carried downstream by irrigation runoff. (See "Environmental Impacts of Irrigated Agriculture.")
Remarkably, despite the well-documented adverse environmental and health impacts of farm runoff, its contamination is largely unregulated by either federal or state law. Agriculture, California's largest and most politically powerful industry, is not subject to the Clean Water Act or most state water quality laws.
Public health groups are suing to end this exemption, just as the state recently made agriculture subject for the first time to air quality laws. But the continued flow of water subsidies to a relative handful of the largest farms, and the lack of conservation incentives, are major factors leading not only to the inefficient use of water but also to water pollution. Unless reform addresses the amount of water farms receive and the price they pay for it, as well as the runoff they discharge, the Central Valley Project will continue to be a disaster for taxpayers and the environment.
Conclusion
As California's largest industry, agriculture's fate depends on the cost and supply of irrigation water. Our analysis of federal subsidies to the Central Valley Project raises profound questions about how water is priced, and whether the current distribution of water is in society's best interest.
We have documented severe inequities in the distribution and pricing of water — between large and small farms, between farmers and urban users, and between farm use and the use of water to protect and restore the environment. It's one thing to ask taxpayers to subsidize farming with cheap water. It's another thing when those subsidies top $400 million a year, and still another when the great majority of the subsidies are going to the largest, wealthiest farms. It is also more than fair to question whether society can afford anything but the most efficient use of water it supplies to agriculture with respect to irrigation technologies and crop choices.
Since the CVP was begun in 1936, California has changed almost beyond measure. So has California agriculture. Large agribusinesses and some farm organizations argue that those changes mean that it is no longer realistic to limit subsidized water to 960 acres. They argue that large operations not only require but have a right to the current amount of subsidized water they receive. These same interests continue to push for development of additional irrigation water supplies, often at the expense of the environment and other potential users. EWG is far more sympathetic to a competing notion: Even fairly small and medium-sized farms, growing high-value crops with highly efficient irrigation technology, can compete and provide a living to more families if the water subsidy system weren't tilted so heavily to a relative handful of giant agribusinesses.
As the contracts governing CVP subsidies are renegotiated, it's time for an honest debate about how the water needs of all Californians will be met in the 21st Century. That debate must take place in public, not behind the closed doors of negotiations between the Bureau of Reclamation and CVP recipients. It must also take place with full public access to information about who gets subsidized water, how much they get and what they pay. Above all it must ask: Is the current subsidy system fair enough to lock in for another 50 years? The numbers say no.
Footnotes
(a) - This is a very conservative estimate based on studies by the Bureau of Reclamation and the state Department of Water Resources of the projected cost of water from a new dam on the San Joaquin River. The actual cost of this water could be twice as high. For more information on how we calculated this rate, see Methodology.
(b) - Article 10, Sec. 5: "The use of all water now appropriated, or that may hereafter be appropriated, for sale, rental, or distribution, is hereby declared to be a public use, and subject to the regulation and control of the State, in the manner to be prescribed by law."
(c) - Farmers may get subsidized CVP water for more than 960 acres, but the subsidy is smaller than for the first 960 acres.
(d) - Overall, the CVP carried a much larger volume of water in 2002 - about 6.5 million acre-feet. Although about 90 percent of this water went to agriculture, about half of it was delivered for free to farmers (mostly because of historical water rights). For our analysis, we only considered the CVP irrigation water that was paid for in 2002 by permanent contractors.
About the Central Valley Project
The Central Valley Project (CVP) is the largest federal water supply project in the country. First authorized in 1936, the CVP now encompasses 20 dams and reservoirs, 1,437 miles of canals, 192 miles of drains, and an array of pumping and power generating facilities.
Although the CVP carries some water for urban and industrial use, it was constructed mainly to provide water for irrigation of the San Joaquin and Sacramento valleys. Today, agriculture uses about 90 percent of the 7 to 8 million acre-feet (a) of water carried by the CVP each year to irrigate roughly 3 million acres of cropland. (An acre-foot is the amount of water needed to cover an acre of land one foot deep, or 325,851 gallons.) [1,2] Major crops grown in the CVP include cotton, rice, and alfalfa hay. Extending nearly 500 miles from north to south, the CVP transformed millions of acres of land that was essentially desert into fertile farmland. At the same time, the CVP dramatically altered the natural flows, water quality and ecology of the Sacramento and San Joaquin rivers, their watersheds, and the San Francisco Bay and Delta. [1]
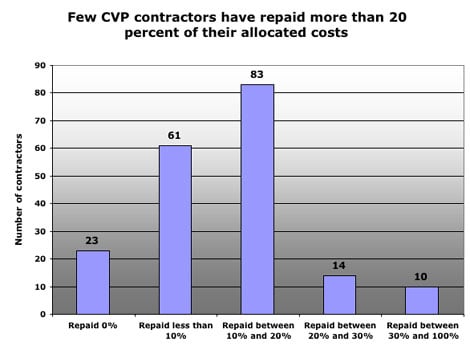
This massive project carried an equally massive price tag: The CVP cost the federal government $3.6 billion to construct. Part of the original deal was that farmers would pay back over $1 billion of this cost within 50 years of project completion. [1] But in 2002 — more than 60 years since the water began flowing — irrigators had only paid back 11 percent of the tab. The reason? CVP recipients had signed 40-year contracts that granted farmers water at rates far below what was necessary to pay back the construction costs.
Source: [11,26]
In fact, some of the water rates stipulated in these 40-year contracts were so low that they don't even cover the costs to the government of delivering the water. In 2002, for example, the contract rate for 17 CVP water districts, that together paid for almost 300,000 acre-feet of water, was just $2 per acre-foot. [11] Yet the cost for delivering this water to these districts was more than $10 per acre-foot. As a result, by 2002, 19 districts had repaid none of their share of the costs. Two districts did better than that: They had repaid $2 and $1.
Source: [11]
Table. Twenty-two water districts have paid back less than $3.00 toward their allocated costs.
| CVP contractor | Allocated CVP capital costs | Total amount of capital costs repaid (to 9/30/02) |
|---|---|---|
| Orland-Artois Water District | $21,482,622 | $2.00 |
| Kanawha Water District | $13,419,422 | $1.00 |
| Colusa County Water District | $28,097,248 | $0.00 |
| Westside Water District | $21,272,949 | $0.00 |
| Corning Water District | $10,524,656 | $0.00 |
| James Irrigation District | $8,607,065 | $0.00 |
| Dunnigan Water District | $5,848,489 | $0.00 |
| Patterson Water District | $3,862,811 | $0.00 |
| Glide Water District | $2,692,178 | $0.00 |
| Thomes Creek Water District | $2,104,528 | $0.00 |
| La Grande Water District | $1,667,580 | $0.00 |
| Proberta Water District | $1,540,944 | $0.00 |
| Davis Water District | $1,119,850 | $0.00 |
| 4-M Water District | $1,094,971 | $0.00 |
| Garfield Water District | $1,059,683 | $0.00 |
| Fresno Slough Water District | $927,996 | $0.00 |
| Holthouse Water District | $541,502 | $0.00 |
| Cortina Water District | $526,974 | $0.00 |
| Kirkwood Water District | $380,533 | $0.00 |
| Glenn Valley Water District | $341,826 | $0.00 |
| Myers-Marsh Mutual Water Company | $63,754 | $0.00 |
| Reclamation District #1606 | $51,498 | $0.00 |
Irrigators are not only failing to pay back what they owe, they are also receiving an additional subsidy: No interest. While municipal and industrial users of CVP water must pay back their tab plus interest, farmers get to pay theirs back interest-free. This policy dates to the turn of the 20th century, when the federal government was looking to develop water supplies and other incentives to settle the West. The Reclamation Act of 1902 stated that "charges shall be determined with a view of returning to the reclamation fund the estimated cost of construction of the project." The Bureau subsequently interpreted this to mean that irrigators would not be required to pay back interest — in effect granting farmers a huge subsidy. [3]
This isn't the only hidden subsidy farmers are getting. For instance, if the Bureau projects that some districts are unable to pay anything towards their allocated costs, the agency increases the rates for power users and applies this money towards the district's debts. As of 2002, 21 CVP contractors had received such "capital relief" totaling more than $21 million dollars, but had paid just $411,041 towards their CVP construction tab. [11] In addition, for decades the Bureau had a policy of extending the repayment period every time a new piece of the CVP was built. That is, instead of setting a fixed repayment date 50 years after the water started flowing to most farmers, the Bureau reset the repayment clock each time a new facility was added to the project allowing payments to be spread out over a much longer period. This policy, which has now ended, increased the farmer's subsidies even more. [3]
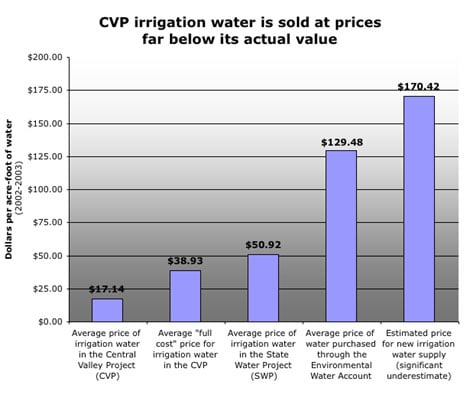
The bottom line is that farmers are getting CVP water at artificially cheap prices. According to EWG's analysis of the Bureau of Reclamation's records, in 2002 farmers in the CVP paid an average of $17.14 an acre-foot for their irrigation water. That's one cent for every 190 gallons.
If irrigators were to pay operation and maintenance charges, make payments towards capital costs, and pay interest on these costs (calculated from 1982), according to the Bureau's figures irrigators would be paying $38.93 per acre-foot on average. (This is the average "full cost" price for CVP water in 2002-3, according to the Bureau's records.) In comparison, farmers in the State Water Project (SWP), a state-run project that parallels the CVP in some areas, paid an average of $50.92 per acre-foot for irrigation water in 2002 and 2003. [15, 16]
Even higher prices are paid by the state to buy water to put into the Environmental Water Account (EWA). Think of the EWA as a virtual water district whose customers are fish. Operated by the state since 2000 as part of a larger program to restore ecosystem health, the EWA buys water from willing sellers (mostly irrigation water users) within the CVP and SWP at market rates. In 2002-2003, the EWA paid an average of $129.48 for water. [17]
Finally, compare CVP users' prices to the cost of providing new water supplies. Feasibility assessments for several proposed new or expanded dams on the San Joaquin River show that this irrigation water from the newly created reservoirs would cost at least $170.42 per acre-foot — and probably a lot more. [18] Prices for urban water users are even higher: $625 per acre-foot of water in San Francisco and $925 per acre-foot in Los Angeles. [8]
Source: [11]
Such artificially cheap irrigation water has led to a host of problems besides the CVP-sized hole in the federal treasury. It has discouraged efficient water use and led to the planting of highly water-intensive crops such as rice and alfalfa in what is naturally a desert. This in turn has depleted the water available for wildlife and urban users and wildlife has paid the price. Of 29 fish species native to the Sacramento and San Joaquin Rivers and the Bay-Delta, two are extinct, six are endangered, five are rare, and nine others are declining. [2]
Cheap water has also made feasible the continued farming of land that is unsuitable to irrigation because of serious drainage problems. And it has created an uneven playing field whereby farmers getting CVP water pay far less than farmers receiving water from the State Water Project or other water projects.
Attempts at reform
Under the Reclamation Act of 1902, farmers were only allowed to get federally subsidized water for 160 acres of cropland, and they had to live on or near this land. The original intention of the law was to promote small family farms by enabling farmers to get cheap water. The acreage limitation was put in place to limit the amount of federal benefits accruing to any one party. [3]
But because the Act made no mention of leasing, by the 1970s it was clear that many farmers had taken advantage of this loophole to get cheap water for much larger acreage swaths. In its first major attempt to limit the water subsidies given to CVP farmers, Congress passed the Reclamation Reform Act (RRA) in 1982. (Although water districts and the irrigators within each of the districts were given the option of opting out of the RRA, the new statute provided incentives for opting in and most have done so.)
Under the Reform Act, farmers are allowed to get subsidized water for 960 acres of land (which was considered the size of an economically viable family farm), but must pay at least the full operation and maintenance (O&M) charges for this water. Farmers may also lease any number of acres under the revised law, but are required to pay the much higher "full cost" price for water used on any leased lands in excess of 960 acres. The Reform Act also instituted another major change to reclamation law: Farmers are no longer required to live on or near their farms to get federally subsidized water. This, in effect, removed one of the original justifications for the provision of cheap water in the first place: to settle the West with small family farms. [3] And it enabled individuals, partnerships, or corporations to operate farms as absentee landlords while still receiving taxpayer-funded water subsidies.
Yet even after the Reform Act went into effect, many CVP farmers still managed to get around the acreage limitations and receive highly subsidized water for large farms. The Bureau of Reclamation itself opened this loophole. The RRA does not specifically address whether multiple landholdings can be operated as one farm but still qualify for federally subsidized water; this detail was left to the Bureau to flesh out in its regulations. Unfortunately, as the Government Accounting Office (GAO) made clear in a 1989 report, the Bureau's implementing regulations did not "reflect congressional expectations." [4]
Under the Bureau's regulations, farmers can simply divide up their land holdings through a combination of partnerships, corporations or trusts. A 5,000 acre farm becomes five or six smaller farms — on paper. But in reality, farmers continue to farm the land as one unit and get subsidized water to irrigate all of it.
The GAO report took a closeup look at how eight large farms had responded to implementation of the Reform Act and found that only two had let go of their leased land in excess of 960 acres. In the other six, however, the GAO found that "the owners or lessees had reorganized large farms into multiple, smaller landholdings to be eligible to receive additional federally subsidized irrigation water from the Bureau." [4] Because of the way that the Bureau conducts its audits of which farms are eligible for subsidized water, GAO also concluded that the agency would "likely continue to find general compliance" with RRA, "even though some landholdings are, in reality, parts of larger farms."
The RRA aimed to reform all western federal water projects. But within a decade, abuses were so rampant in the CVP that in 1992 Congress passed the Central Valley Project Improvement Act (CVPIA). Aimed at improving the "operational flexibility" of the CVP and reducing its impact on fish and wildlife habitat, the Improvement Act limited water contract terms to 25 years (rather than the previous 40 years), allowed the creation of a water market whereby contractors could sell water that they didn't need to other water users (often at a hefty profit), and dedicated 800,000 acre-feet of water to fish and wildlife needs.
The Improvement Act also outlined a tiered pricing structure: The first 80 percent of a contractor's water allotment is paid at the contract price, the next 10 percent is paid at the average of the contract and the Bureau's "full cost" price, and the last 10 percent is paid at the "full cost" price. The revenues from this tiered pricing are supposed to go into a habitat restoration fund of up to $50 million annually. Unfortunately, because CVP water is over-allocated, most contractors don't receive more than 80 percent of their allotted amount in a given year, meaning that in practice the tiered pricing structure falls short of its promise.
As the Bureau of Reclamation has begun to renew CVP contracts, it is also clear that the agency is failing to implement the reforms called for by the CVP Improvement Act, just as it earlier failed to implement the Reclamation Reform Act.
As detailed in a recent analysis by the budget watchdog group Taxpayers for Common Sense, the Bureau is in the process of locking up millions of acre-feet of California water — and locking in massive subsidies — for the next 25 to 50 years. The new contract provisions being negotiated, and in some cases already finalized, virtually guarantee contract renewal for at least an additional 25 years, simply provided that contractors comply with current federal law. This in essence turns 25-year contracts into 50-year deals without the need for a public comment period or a reassessment of price structures and water needs. [8] Furthermore, the Bureau is not significantly changing the water amounts allocated to each contractor or the price they pay for this water, making it highly unlikely that the CVP will be paid off by 2030 as required.
Footnotes
(a) - In 2002, CVP carried about 6.5 million acre-feet of water. Of the ninety percent that went to agriculture, about half of it was provided to farmers for free (mostly because of historical water rights). For our analysis, we only considered the 2.7 million acre-feet of CVP irrigation water that was paid for in 2002 by permanent contractors.
Environmental Impacts of Irrigated Agriculture
In 1982, ducks and other waterfowl began dying mysteriously at the Kesterson National Wildlife Refuge in Merced County. By the spring of 1983, record numbers of migratory birds were emerging from their eggs with massive deformities, including misshapen beaks, twisted legs, missing wings, and incompletely formed skulls. More than 1,000 waterfowl eventually died.
Biologists found that water in the refuge contained high levels of selenium, a usually benign trace element that can be deadly to wildlife and humans in high concentrations. The compound was reaching the refuge in drainage water coming from the highly saline soils of the San Luis Unit of the Central Valley Project. The selenium concentrated in Kesterson's water and vegetation and poisoned birds and other wildlife.
In 1985 the selenium contamination forced officials to close the San Luis Drain, a cement canal used to funnel waste waters away from farmland in the western San Joaquin Valley. The canal had been built in the 1970s during an era of large-scale expansion of federal irrigation projects. It carried millions of gallons of agricultural waste water to Kesterson, where the federal government used the water to flood the ponds and marshes, creating the wildlife habitat — but also creating a conduit for environmental devastation.
Less than five years later, 100 miles to the south, even higher levels of selenium were found near the Kern National Wildlife Refuge, this time in evaporation ponds used to hold farm runoff. Emergency measures were instituted to reduce runoff to the ponds, but to save waterfowl the U.S. Fish and Wildlife Service was forced to scare birds away. A subsequent study by the Fish and Wildlife Service found that about one in 10 of the nation's 430 federally protected wildlife refuges could be contaminated by agricultural runoff.
Prompted by the Kesterson and Kern disasters, the National Research Council conducted an extensive investigation of irrigation-induced water quality problems, concluding: "The contaminants of concern and the severity of impacts may vary, but the phenomenon of irrigation-induced water quality contamination can no longer be ignored." [19] The chair of the study, Jan van Schilfgaarde, associate director of the U.S. Agricultural Research Service in Fort Collins, Colo., wrote: "Action is necessary if recurrences of Kesterson-like scenarios and potential adverse human health effects from poor water quality are to be avoided. The national benefit from irrigated agriculture in the West is unquestionably great, but the laws of nature cannot be waived." [20]
The Central Valley Project — which enables water-intensive crops to grow in a near-desert — is both an audacious attempt to change nature and a clear example of the inevitable environmental degradation.
According to the USDA, agriculture is "the leading source of remaining impairments in the Nation's rivers and lakes and a major source of impairments to estuaries." [21] Agriculture degrades water quality by increasing the concentrations of natural constituents such as dissolved solids, salts, suspended sediment, dissolved organic carbon, trace elements and nitrate, as well as man-made constituents such as pesticides and nutrients from fertilizers. [22] These pollutants have a variety of adverse effects.
Fertilizers: Nitrogen and phosphorous, both a major component of many fertilizers, often accelerate algal and other biological production; this can in turn lower dissolved oxygen levels, sometimes to such an extent that the water is unable to support life.
Excess nitrate in drinking water is also a serious human health concern. Each year, fertilizers add 8 billion pounds more nitrogen to farm fields than are used in raising the crops planted on them. This excess nitrogen has to go somewhere, and much of it ends up in drinking water supplies. Nitrate in drinking water at levels greater than the federal standard of 10 parts per million can cause a potentially fatal condition in infants commonly known as "blue-baby" syndrome (methemoglobinemia). Babies can develop blue-baby syndrome after drinking water contaminated with nitrate levels greater than 10 ppm for as little as one week.
In 1996, EWG reviewed nearly 200,000 water sampling records and found that more than 2 million people nationwide drank water from systems that had been reported to the EPA for significant violations of the nitrate standard during the previous decade. In California, more than 380,000 people — most of them in the San Joaquin Valley — drank water that violated the standard.
LINK: https://www.ewg.org/reports/Nitrate
Pesticides: More than 1 billion pounds of chemical pesticides are applied to U.S. farms each year, and like nitrates in fertilizer, what's not used by the crop goes into runoff, which makes its way into drinking water. Exposure to pesticides in drinking water has been linked to a wide range of adverse health effects in humans and laboratory animals including cancer, Parkinson's disease, immune system depression, and endocrine disruption. Of particular concern is the herbicide atrazine, little used in California, but heavily used on corn in the Midwest. A 1998 EWG study found that tap water in a dozen Ohio communities was contaminated, at levels well above federal safety standards, with atrazine and other agricultural chemicals.
LINK: https://www.ewg.org/research/consider-source
Sediment and bacterial solids: Sediment and dissolved solids from animal waste and other sources can degrade wildlife habitat, increase the costs of drinking water treatment, and lead to the formation of toxic chlorination byproducts such as trihalomethanes (THMs), which are linked to miscarriages and birth defects. [21, 23] A compelling body of scientific evidence - nearly 30 peer-reviewed epidemiologic studies - links chlorination byproducts to increased risks of cancer. At current levels in U.S. tap water, EPA estimates that chlorination byproducts cause up to 9,300 cases of bladder cancer each year.
LINK: https://www.ewg.org/research/consider-source
Irrigated cropland has even greater impact on water quality than other types of agriculture. [24] First, applied water increases field erosion rates, which means higher sediment levels in receiving waters. The greater drainage flows associated with irrigation also mean accelerated pollutant transport. These factors are linked, because many contaminants such as pesticides, metals and nutrients bind to sediment. In addition, studies have shown that irrigated crop production uses more chemical pesticides and fertilizers than non-irrigated crop production, which means more chemicals in the runoff water.
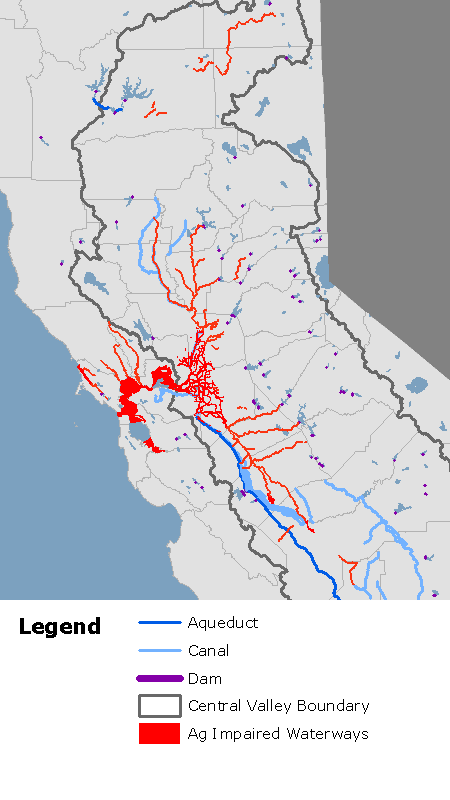
Under the federal Clean Water Act, every other year California must submit to the EPA a list of all the "impaired" waters in the state — those unsuitable for drinking, swimming, fishing or wildlife habitat. This list of impaired waters must also include information on the type of water quality issues affecting each water body and the likely sources of these pollutants and stressors.
The state's most recent impaired waters list includes more than 700 miles of rivers, creeks and sloughs in the Central Valley, plus almost 55,000 acres of wetlands and estuaries where impaired water quality is linked to agriculture. [25] The problems listed include everything from excess sediment and altered stream temperatures to contamination with toxins such as selenium and seventeen different pesticides.
The affected waters include large, well-known rivers such as the Tuolumne, Merced, San Joaquin, Stanislaus, Sacramento and Feather. The most highly contaminated is the San Joaquin, contaminated with 12 different pesticides as well as selenium and boron. Several others are close behind: the lower Merced River is polluted with 11 different pesticides; the lower Tuolumne is polluted with 10.
Table: Agriculture impairs more than 700 miles of rivers in the Central Valley
| River, Creek or Slough | Total Miles affected | Agriculture-related Pollutants/Stressors |
|---|---|---|
| Arcade Creek | 9.9 Miles | Diazinon |
| Bear River, Lower | 21 Miles | Diazinon |
| Chicken Ranch Slough | 8 Miles | Diazinon |
| Clover Creek | 11 Miles | Fecal Coliform |
| Del Puerto Creek | 6.5 Miles | Chlorpyrifos, Diazinon |
| Elder Creek | 11 Miles | Diazinon |
| Elk Grove Creek | 6.9 Miles | Diazinon |
| Fall River | 8.6 Miles | Sedimentation/Siltation |
| Feather River, Lower | 42 Miles | Aldrin, Chlordane, Diazinon, Dieldrin, Endosulfan, Endrin, Heptachlor, Heptachlor epoxide, Hexachlorocyclohexane, Toxaphene |
| Five Mile Slough | 1.6 Miles | Diazinon |
| Ingram/Hospital Creek | 1 Miles | Chlorpyrifos, Diazinon |
| Jack Slough | 14 Miles | Diazinon |
| Kings River, Lower | 36 Miles | Electrical Conductivity, Molybdenum, Toxaphene |
| Merced River, Lower | 50 Miles | Chlorpyrifos, Diazinon, Aldrin, Dieldrin, Chlordane, Endosulfan, Endrin, Heptachlor, Heptachlor epoxide, Hexachlorocyclohexane, Toxaphene |
| Mormon Slough | 22.3 Miles | Diazinon |
| Mosher Slough | 1.3 Miles | Diazinon |
| Mud Slough | 13 Miles | Boron, Electrical Conductivity, "Pesticides", Selenium, "Unknown Toxicity" |
| Orestimba Creek | 11.8 Miles | Azinphos-methyl, Chlorpyrifos, DDE, Diazinon, "Unknown Toxicity" |
| Panoche Creek | 18 Miles | Sedimentation/Siltation, Selenium |
| Pit River | 123 Miles | Nutrients, Organic Enrichment/Low Dissolved Oxygen, Temperature |
| Sacramento River | 16 Miles | Diazinon |
| Sacramento Slough | 1.7 Miles | Diazinon |
| Salt Slough | 17 Miles | Boron, Chlorpyrifos, Diazinon, Electrical Conductivity, "Unknown Toxicity" |
| San Joaquin River | 127 Miles | Aldrin, Boron, Chlordane, Chlorpyrifos, DDT, Diazinon, Dieldrin, Electrical Conductivity, Endosulfan, Endrin, Heptachlor, Heptachlor epoxide, Hexachlorocyclohexane, Selenium, Toxaphene |
| South Cow Creek | 7.9 Miles | Fecal Coliform |
| Stanislaus River, Lower | 59 Miles | Aldrin, Chlordane, Diazinon, Dieldrin, Endosulfan, Endrin, Heptachlor, Heptachlor epoxide, Hexachlorocyclohexane, Toxaphene |
| Strong Ranch Slough | 6.4 Miles | Diazinon |
| Tuolumne River, Lower | 60 Miles | Aldrin, Chlordane, Diazinon, Dieldrin, Endosulfan, Endrin, Heptachlor, Heptachlor epoxide, Hexachlorocyclohexane, Toxaphene |
| Wolf Creek | 23 Miles | Fecal Coliform |
| Total number of miles affected: 714 Miles | ||
Source: [25]
MAP: Ag-contaminated rivers in the Central Valley
Worse, despite the well-documented adverse environmental and health impacts of farm runoff, this source of contamination remains mostly unregulated. While other industries must comply with federal regulations designed to keep drinking water clean and healthy and make all of the nation's waters "swimmable and fishable," agricultural discharges remain exempt under the federal Clean Water Act.
Agriculture is California's largest industry, but the only one exempted from most water pollution standards. In recent years, a statewide coalition of public interest groups has campaigned to regulate agricultural water pollution, saying the exemption permits runoff containing pesticides, nitrates, and heavy metals from over 7 million acres of farmland to contaminate hundreds of miles of waterways and ultimately drinking water. In early 2004, after the Central Valley Regional Water Quality Control Board voted to extend the exemptions, Earthjustice, Waterkeepers and other groups sued to force the regional board and the State Water Resources Control Board to regulate farm runoff.
Recommendations
- All CVP water districts should be required to maintain and disclose their records of water use at the individual farm level. This transparency should not be limited to the CVP: All other federal water projects should monitor and disclose who uses how much of this water. The public has a right to know.
- Contracts with CVP irrigation water users should be based on prices closer to market rate. The Bureau of Reclamation's "full cost" rate should be considered the absolute baseline.
- Price incentives should be based on measures of environmental responsibility. The current "tiered pricing" system calls for higher rates to be paid for water above 80 percent of the recipient's allotment. These higher rates are supposed to provide $50 million a year to a habitat restoration account. Since CVP water is over-allocated, most recipients don't get more than 80 percent of their allotment, so the account is underfunded. To correct this, tiered pricing should be applied to the water each recipient actually gets.
- Farmers should not be allowed to resell the public its own water at a higher price. If farmers get more water than they need, it should be returned to the Environmental Water Account at the same price the farmer paid. In return for water saved and returned to the EWA, farmers should receive a reasonable discount on the water they buy the following year.
- Farmers should be required to comply with all state and federal water quality regulations, just as other California industries are.
- Contracts should not include provisions for essentially automatic renewal after 25 years. Such long-term provisions do not give the state sufficient flexibility to address changing water needs.
Glossary
Acre-foot: The amount of water needed to cover an acre of land one foot deep, or 325,851 gallons.
Bureau of Reclamation: Federal government agency, part of the Interior Department that oversees the Central Valley Project and 180 other federal water projects in 17 Western states.
Central Valley Project Improvement Act (CVPIA): 1992 law by Rep. George Miller of California, aimed at reforming the CVP's operations and reducing its impact on fish and wildlife habitat. Instituted pricing reforms and restricted contracts to 25 years in length.
Environmental Water Account (EWA): Federal-state joint agency that buys water from contractors in the CVP and SWP at market rates to use for restoring fish and wildlife habitat in the San Francisco Bay-Delta. A virtual water district whose customers are fish.
"Full cost" price: Water rate calculated by the Bureau of Reclamation each year for each CVP contractor. Includes full operation and maintenance charges, payments towards capital costs, and interest on these costs calculated from 1982.
Recipient (or contractor): A farm or water user organization (water district, irrigation district or mutual water company) that contracts with the Bureau of Reclamation for CVP water.
Reclamation Reform Act (RRA): 1982 law intended to limit the amount of federally subsidized water that any one farm could receive. Applied not only to the CVP, but to all federal water projects in the West.
Replacement cost: The estimated price, according to studies by the Bureau of Reclamation and the California Department of Water Resources, of irrigation water from a new dam on the San Joaquin River. This price, which is used to calculate our top subsidy estimate, is a significant underestimate — the real cost could be twice as much.
State Water Project: Large, state-run project that provides water for agricultural and urban users in California. The State Water Project parallels the CVP in some areas but charges much higher prices for its water.
Water district: A water user organization — water district, irrigation district or private mutual water company — that contracts with the Bureau of Reclamation for Central Valley Project water.
Frequently Asked Questions
About the Database
How did you do these calculations?
See "Methodology" section.
Why are you posting this information?
The public has a right to know where its water is going, and whether recipients are paying their fair share in a time of increasing cost and scarcity. What's more, the public, elected officials and regulatory agencies need this information now in order to make informed decisions about the future use of California's most valuable natural resource. The U.S. Bureau of Reclamation is in the midst of negotiating new contracts with virtually all of the CVP's irrigation water users. These contracts will affect the fate of millions of acre-feet of California's water for the next 25 to 50 years.
Why do you have minimum and maximum subsidy figures for some farms but not others? Why is there such a big range in some cases?
A few farms contract directly with the Bureau of Reclamation for their water so we know exactly how much water (and subsidies) they are getting. For the rest, we are forced to estimate. Although we calculated minimum and maximum subsidy estimates for all farms, when these estimates differed by less than 10 percent, we cited only the lower value in our database. (For more information about how we calculated these estimates, see "Methodology" section.)
Farms that harvested more than 960 acres in 2002 are likely to have a wide subsidy range in our database for the following reason: Under the Reclamation Reform Act, farmers are allowed to get cheap federal water to irrigate only 960 acres worth of cropland. Although they are still allowed to purchase federal water to irrigate land in excess of 960 acres, farmers are supposed to pay "full cost" prices for this water. In reality, however, many farmers have been able to skirt these acreage limitations (as documented by the Government Accounting Office, among others) and get subsidized water for cropland far in excess of 960 acres. To address this issue, EWG calculated minimum and maximum subsidy figures for those farms that harvested more than 960 acres of crops in 2002. For our minimum subsidy calculations, we assumed that the first 960 acres of crops irrigated was paid at the average water rate and the rest of the water was paid at the Bureau's "full cost" rate — as it is supposed to be but often isn't. For our maximum subsidy calculations, we assumed that all of the water the farm used that year was paid at the Bureau's contract rate. For those farms with harvested acreage far in excess of 960 acres, the subsidy range for the "full-cost" rate will often be high because there is such a difference between contract and "full-cost" water rates.
Why is my farm listed here when I don't get any CVP water?
Because farm-level water use records are off-limit to public review, EWG was forced to rely on California's 2002 pesticide use database to identify the farms residing in each CVP water district and estimate total CVP water use. If a farm residing within the boundaries of a given water district doesn't actually get any CVP water from that district, this farm will appear in EWG's water subsidy database erroneously. We will promptly correct any errors brought to our attention.
Why isn't my farm listed here when I know I get CVP water?
Because farm-level water use records are off-limit to public review, EWG was forced to rely on California's 2002 pesticide use database to identify the farms residing in each CVP water district and estimate total CVP water use. If a farm did not use any pesticides in 2002 (or did not register their use with the state as required), this farm will not appear in EWG's water subsidy database. We also excluded 7 water districts from our analysis due to data deficiencies, because they did not receive any CVP water in 2002, or other related issues: Colusa Drain Municipal Water Company, the County of Sacramento, Lewis Creek Water District, Placer County Water Agency, Rag Gulch Water District, Santa Clara Valley Water District, Widren Water District.
Why is my farm listed as getting CVP water from two different water districts when I only get water from one?
Because farm-level water use records are off-limit to public review, EWG was forced to rely on California's 2002 pesticide use database to identify the farms residing in each CVP water district and estimate total CVP water use. To do this, EWG overlaid farm boundaries as delineated in the pesticide use database with water district boundaries. If two-thirds of a farm fell in "Water District A" and the other third fell in "Water District B", EWG assumed that the crops planted in "Water District A" were being irrigated with water from this district while the rest of the crops were being irrigated with water from "Water District B." This may not be true in all cases. Again, we will correct any errors if notified.
The amount of CVP water my farm is listed as getting is wrong. Why?
Because farm-level water use records are off-limit to public review, EWG was forced to rely on California's 2002 pesticide use database to identify the farms residing in each CVP water district and estimate total CVP water use. To do this, EWG made a number of assumptions that may not be true for all farms in all districts. For example, EWG was forced to assume that within a given district, every farm uses the same ratio of CVP to non-CVP water for irrigation; this may not be the case in practice. EWG also had to rely on the Bureau of Reclamation's annual published ratebooks for data on how much CVP water was delivered to each district. Unfortunately, the agency lumps together its corrections and adjustments from previous years with its water use and payment data for the current year. As a result, the information in the Bureau's annual reports may not be a perfect reflection of the actual amount of water used or money paid in some cases.
Why are there a few water districts where no farm-level subsidy information is provided?
EWG excluded a small number of water districts from farm-level subsidy analyses because of data limitations. EWG also excluded a small number of water districts from district-level analyses because a few districts received no CVP water in 2002 and a few had unresolvable data discrepancies.
Why does the database have crop details for some farms but not others?
The database does not include crop details for those farmers who contract with the Bureau of Reclamation directly.
Why does the database have contact names for some farms but not others?
The database includes contact names when that information was included in the state's pesticide use report database.
About Water Subsidies
Why did you only look at the CVP? What about other federal water projects? Don't they get subsidies too?
CVP farmers are not the only ones receiving water subsidies. All irrigation water supplied by the US Bureau of Reclamation is subsidized because farmers are not required to pay interest on construction costs, and the CVP is an example of the much larger issue of subsidized irrigation water. EWG focused on the CVP for several reasons. First, although the Bureau of Reclamation operates more than 130 water projects in 17 western states, the CVP is arguably the most important. Not only is it the largest federal water project in the nation, but 43 percent of Reclamation project land lies in California. Second, CVP farmers have done a particularly poor job at repaying their share of project construction costs. Third, data availability issues would make it difficult to perform similar calculations on any federal water project outside California. Fourth, the Bureau of Reclamation is in the midst of negotiating new contracts with virtually all of the CVP's irrigation water users, which will affect the fate of millions of acre-feet of California's water for the next 25 to 50 years.
Do other (non-farm) users of CVP water get subsidies too?
Yes, but they are far smaller than what irrigators get. For example, in a 1996 report, the General Accounting Office wrote:
"The federal government has spent $21.8 billion to construct 133 water projects in the western United States that provide water for various purposes, including irrigation. The beneficiaries of these projects are generally required to repay to the federal government their allocated share of the costs of constructing these projects. However, as a result of various forms of financial assistance provided by the federal government, some beneficiaries repay considerably less than their full share of these costs. Among the beneficiaries, irrigators generally receive the largest amount of such financial assistance."
While irrigators are not obligated to pay interest on federal water project construction costs, urban and industrial water users are. Yet the interest rates provided to these users are typically lower than market rate, which confers a relatively small subsidy to urban and industrial users. Farmers, however, get a wide range of additional assistance that adds up to huge subsidies. Overall, the GAO found that out of every dollar in construction costs allocated to irrigation, irrigators will only repay 47 cents — and that doesn't even include the already massive interest subsidy that farmers get.
How does the price of CVP irrigation water compare to the price that urban users pay?
Farmers in the CVP pay about $17 per acre-foot of water, on average. Urban water users in San Francisco and Los Angeles, pay about $650 and $925 per acre-foot of water, respectively.
Don't these large water subsidies ensure American consumers access to cheap food?
According to USDA, the grain components of a loaf of bread or box of cereal are only 5 to 7 cents of the full price of these products. Consumers mostly pay for the labor, processing, packaging and transportation for the final food products they buy. Addressing the issue of crop subsidies, one of the most respected agricultural economists in the nation, Dr. Michael Duffy from Iowa State University, recently stated: "The claim that these subsidies are necessary to feed our country and our troops during wartime or anytime, is preposterous." For instance, in 2001, the U.S. exported 53 percent of its wheat crop, 42 percent of its rice crop, 35 percent of its soybean crop, 46 percent of its sorghum crop, and 45 percent of its cotton crop.
Do these large water subsidies help farmers?
According to the California Department of Water Resources, water contributes only a small amount to the total production costs for all but the most water intensive crops. In the Tulare Lake region of California, water costs constitute between 5 and 6 percent, on average, of total production costs for wine grapes, processing tomatoes, almonds and pistachios. This percentage was slightly higher for dry beans, wheat, cotton and sugar beets where water costs contributed between 11 and 14 percent. For the highly water intensive alfalfa hay and irrigated pasture, the percentages were 19 and 36 percent, respectively.
Cheap water encourages the planting of highly water intensive crops and discourages water conservation. It has also allowed the continued farming of land not suitable to irrigation because of drainage problems, the creation of an uneven playing field for farmers not receiving subsidized water, and arguably the concentration of land-holdings in the Central Valley. A 1986 study by the California Institute for Rural Studies found that California farms receiving federally subsidized water are 7.2 times larger on average than farms not receiving subsidized water.
Acknowledgments
Principal author: Renee Sharp
Principal researchers: Renee Sharp and Simona Carini
Editor: Bill Walker
Database and maps: Sean Gray
Web design and graphics: T.C. Greenleaf
For advice, editorial review and comment, thanks to Ken Cook and Richard Wiles of EWG, Hal Candee, Lloyd Carter, Ronnie Cohen, Phil Doe, Ben Miller, Terry O'Day, Aileen Roder and David Sunding.
This investigation was made possible by the generous support of George A. Miller of San Francisco (no relation to Rep. George Miller). The conclusions and opinions in this report are those of the author and editor, who are responsible for any errors. EWG will correct any errors brought to our attention if adequately documented.