


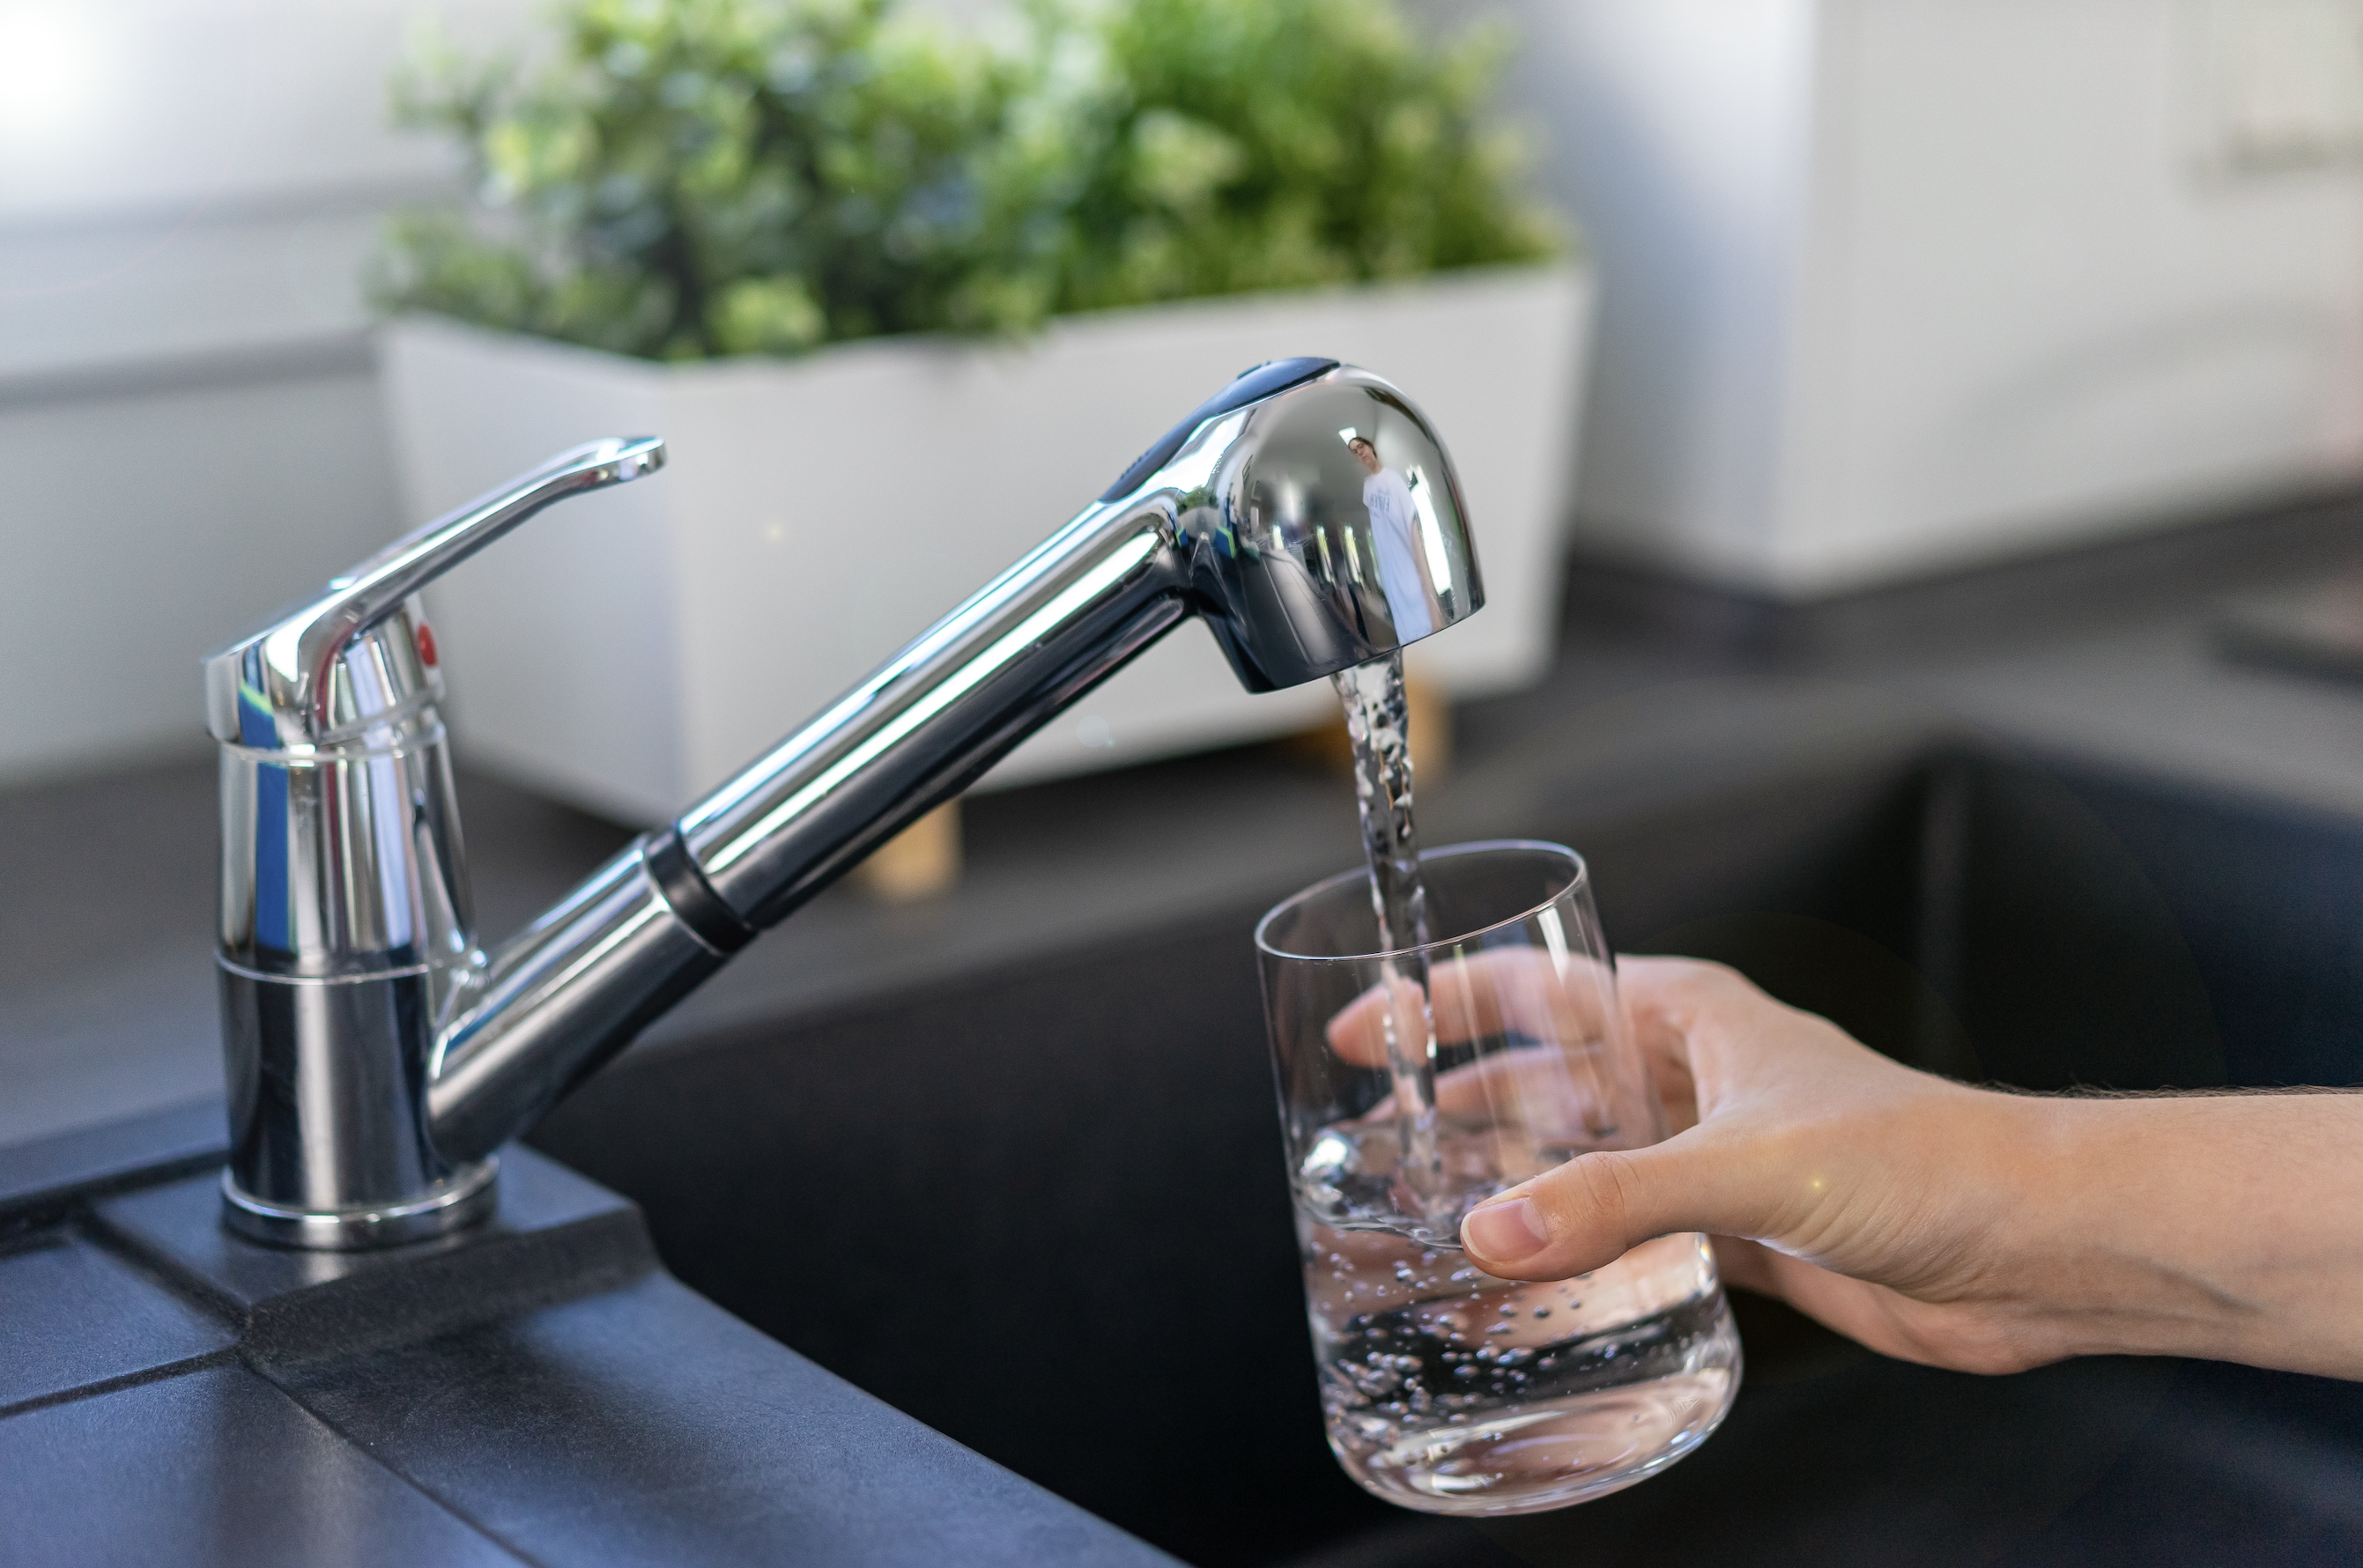
Finding out which contaminants are in tap water takes seconds, thanks to EWG’s Tap Water Database. Gathering that information takes months.
Every year, EWG’s researchers collect, review and sort millions of test results from water utilities nationwide. They add up. The past six years alone account for roughly 35 million sample results, and the full archive stretches back about two decades.
But that behind-the-scenes work helps ensure that the database’s water quality data are accurate, giving people a clearer picture of contaminants like arsenic, the “forever chemicals” known as PFAS, heavy metals, nitrates and others.
And EWG keeps refining its approach to reviewing and evaluating water quality data. Beginning in 2016, EWG implemented a more rigorous quality assurance and quality control process, systematically checking data against Consumer Confidence Reports, to improve the consistency and accuracy of the data included in the database.
All year, every year
When you visit the database, you don’t see any of the painstaking, complicated work that goes into it. Instead, you can simply enter your ZIP code and see what’s in your drinking water.
Data collection starts around March. That’s when EWG’s team begins requesting the latest test results from state drinking water agencies or collecting them directly from state websites where the data is posted publicly.
The Safe Drinking Water Act requires water utilities to publish their annual water quality review by the start of July. Known as the Consumer Confidence Report, it covers the previous calendar year.
Reports from larger systems – those serving tap water to over 10,000 people – are usually online by then.
EWG crosschecks the utilities’ reports against information it already has, looking out for discrepancies or anything unusual. For each system, researchers compare the values the utility published with the results the state provided. If they don’t match, something has gone wrong somewhere, and the team digs in to find out what.
It’s a mostly manual process, so information doesn’t appear in the database the moment a water sample is tested. The results must travel from the utility to the state, which compiles them, then we collect or request them and finally we review them.
What you see in the database is the most recent data to have been checked through that process.
What’s taken out – and why
EWG does not include every possible piece of information in the database. Not every test result a water system reports accurately reflects what comes out of your home faucet.
Many systems test their water both before and after treating it to reduce levels of contaminants. California, for example, requires tests both before and after treatment. Those pretreatment results belong in state records, but they aren’t what anyone drinks and they’re not always labeled “pretreatment.”
Some New York systems filter water through two carbon vessels in sequence: The first is called the “lead” vessel and the second the “lag.” Operators test the water at the start, sometimes in between and at the end. Contaminants’ appearance in the water between the two vessels indicates the first filter’s carbon is almost done and needs replacing. Those in-between test results are useful to the operator, but they don’t show what’s in the water coming out of your faucet.
If EWG combined these samples with results for your faucet tap water, a system’s page could show contaminant levels far higher than what its customers actually drink. So EWG’s researchers run programs that identify and separate pretreatment and midtreatment samples as part of quality control. In California alone, that can mean removing thousands of results in a given year.
But EWG’s team doesn’t delete those findings entirely.
Removed records turn out to be valuable in their own right. Pretreatment data can show where a system has installed treatment to address a specific contaminant – and how much of a difference that treatment made. Those are the kinds of real-world case studies that can assist other communities facing the same problem and inform decisions about future treatment options.
Smarter quality checks
Water quality from a given system usually doesn’t change dramatically from one year to the next.
For the latest update, researchers compared new results, from 2024 and 2025, against each system’s own history over the previous 12 years. Results that fell within the range a system had reported in recent history were tagged as consistent with its track record.
But researchers flagged for a closer look any contaminant that was newly detected, or detected at levels higher than anything seen in the previous 12 years. That approach focuses the team’s attention where it matters most – on the changes – rather than on results that haven’t varied much over a decade.
EWG scrutinizes the biggest systems the most closely. The team checks every aspect of the roughly 700 water systems serving 100,000 or more and reviews the data for all systems serving 25,000 people or more.
Part of that review involves making the data comparable. States and utilities don’t always report results the same way. Some, for instance, report whether a contaminant is present at or above the federal legal limit rather than what the samples actually found.
EWG’s researchers adjust for those differences so results can be compared fairly, whether you’re looking at a small town in one state or a major city in another.
For the technical details about how EWG calculates averages and compares contaminant levels with health guidelines and legal limits, see the full methodology.
Critical human oversight
All this work might seem like a job suitable for artificial intelligence. When AI tools have the right document in front of them, they can help confirm whether a particular value appears in a utility’s water quality report, and what that value is.
The trouble is finding the right document in the first place. Utilities post multiple PDFs of their sample results, reports for different years and reports for different parts of their service area. An AI tool that pulls a number from the wrong report produces a confident but wrong answer.
The problem gets harder with complicated systems – those that draw water from several sources of their own while also buying water from other suppliers. Untangling which results apply to which water, and where it ends up, still takes human judgment.
For now, AI is a useful assistant in this process. It isn’t a replacement for our researchers, who know how water systems actually work.
A resource for researchers
Most people use the Tap Water Database to check their own water. But the data has another important audience: scientists.
EWG scientists, alongside external collaborators, have published or co-authored more than 10 peer-reviewed studies on drinking water quality, with most using data from the Tap Water Database.
Researchers studying the links between drinking water contaminants and human health often need long stretches of data to see patterns emerge. EWG’s archive offers something special: around 20 years of test results. And these decades of data have all been consistently checked for accuracy.
This makes the database useful for epidemiological studies and for tracking contamination problems over time. It fills a gap that, as we explain in our frequently asked questions, Congress directed the federal government to fill decades ago, though it still hasn’t.
What’s new in this year’s data
PFAS testing significantly ramped up at water systems ahead of this year’s database update.
Some large water systems had to start testing for PFAS as far back as 2013. Since then, policy developments have brought many more systems into PFAS testing under the EPA’s Fifth Unregulated Contaminant Monitoring Rule, producing much more PFAS data.
That includes test results for the two most notorious and well-studied forever chemicals, PFOA and PFOS. The Biden EPA set first-time drinking water limits for those toxic chemicals and four other PFAS in 2024, although the Trump EPA has proposed rescinding all but the PFOA and PFOS standards.
The agency has set an April 2027 deadline for water systems to submit their PFAS test results, ahead of a current April 2029 compliance deadline – though the agency is moving to give systems two more years to comply with the PFOA and PFOS drinking water standards.
None of the work that goes into EWG’s Tap Water Database is visible when you look up what’s in your water on the Tap Water Database – and that’s by design.
Every result you see has been requested or collected, screened for pretreatment samples and compared with more than a decade of that system’s history. Outliers have been checked against the utility’s own published reports, and results have been adjusted so they can be compared fairly with systems across the country. That way, everyone from consumers to scientists and others can be confident about what’s in the database.
Look up your water today in EWG’s Tap Water Database.
How to cite: Environmental Working Group. EWG's Tap Water Database, 2026 Update (2020–2025 Data). Environmental Working Group: Washington, DC, 2026. https://www.ewg.org/tapwater/ (accessed [date on or after Oct 14, 2026]).
November 2026