Latinos in some of California’s lowest-income communities are exposed to far higher amounts of paraquat – a toxic weedkiller linked to an increased risk of developing Parkinson’s disease – than other areas, according to a new Environmental Working Group analysis.
In Kern County, a hot spot of paraquat use, two communities with high poverty rates, Shafter and Wasco, have a combined population of almost 50,000 and total paraquat spraying of almost 180,000 pounds between 2017 and 2021. Latinos make up more than 80 percent of the population in both localities, and over 20 percent of residents live below the poverty line.
Three other Latino communities with high rates of poverty also saw peak paraquat use on agricultural fields: Corcoran, Delano and McFarland. (See Table 1.)
Table 1. Top five California communities with the most paraquat sprayed from 2017 to 2021
| City name | County | Population | Paraquat sprayed (lbs) |
Latino population rate |
Poverty rate |
|---|---|---|---|---|---|
| Shafter | Kern | 21,282 | 71,691 | 82% | 23% |
| Wasco | Kern | 27,731 | 45,774 | 87% | 21% |
| Delano | Kern | 50,843 | 14,204 | 76% | 20% |
| McFarland | Kern | 14,019 | 11,171 | 90% | 27% |
| Corcoran | Kings | 22,837 | 10,068 | 74% | 28% |
Source: EWG, from California Department of Pesticide Regulation
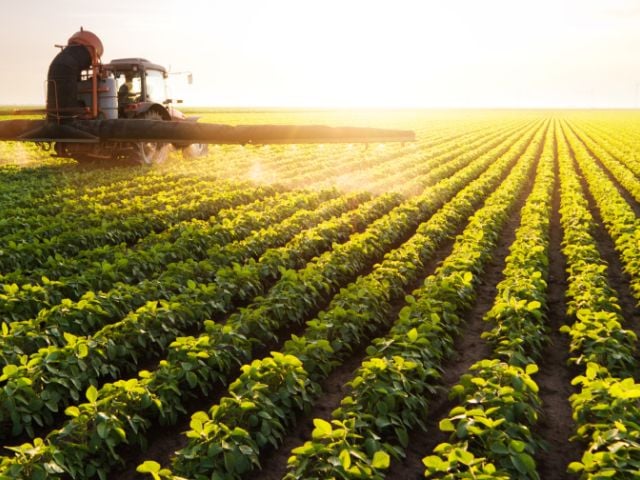
Paraquat is primarily used across the U.S. by farmers for clearing fields before planting almonds, corn, peanuts, soybeans, wine grapes and other crops. Much of the chemical ends up in soil for years, but it can also linger in dust or drift through the air to nearby communities. This poses an increased risk to people living and working near fields who are exposed to paraquat.
In addition to its association with Parkinson’s disease, the chemical has also been linked to other health harms including, non-Hodgkin lymphoma and childhood leukemia.
But even though the Environmental Protection Agency says paraquat is too toxic to use on golf courses, the agency still allows spraying of the herbicide on crop fields.
California is the only state where data are readily available on the location and amount of paraquat used. Overall, 5.3 million pounds of paraquat were sprayed in California between 2017 and 2021, but the majority was sprayed in 10 counties. Just five of those counties – Kern, Kings, Fresno, Tulare and Merced – represent 66 percent of all paraquat use in the state.
Figure 1. Paraquat spray for all one-mile sections in California, between 2017 and 2021.
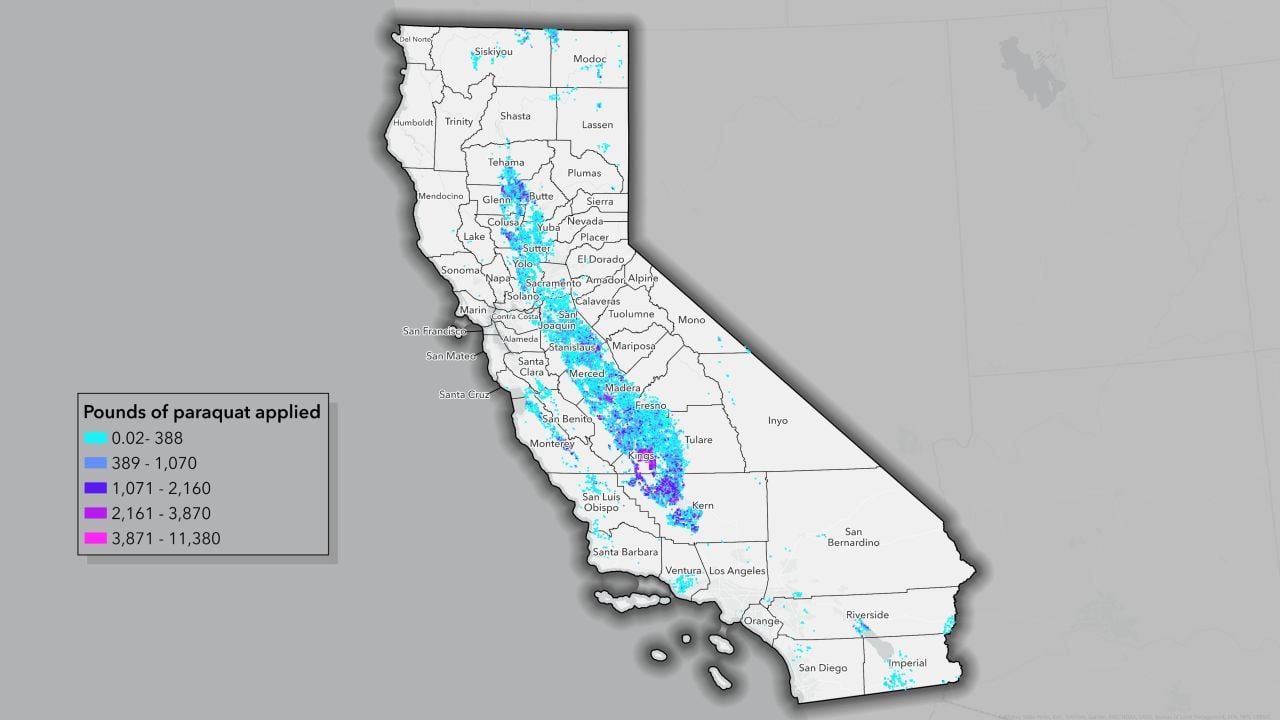
Source: EWG, from California Department of Pesticide Regulation
California provides paraquat spraying data on a section level, for every section in the state. Some “sections,” or a square mile of land, in California receive far more paraquat application than other sections, EWG found. (See Figure 1.)
Lower-income Latinos face greater exposure
Latinos account for 40 percent of California’s population, and they are the majority population in all of the five counties with the most paraquat spraying.
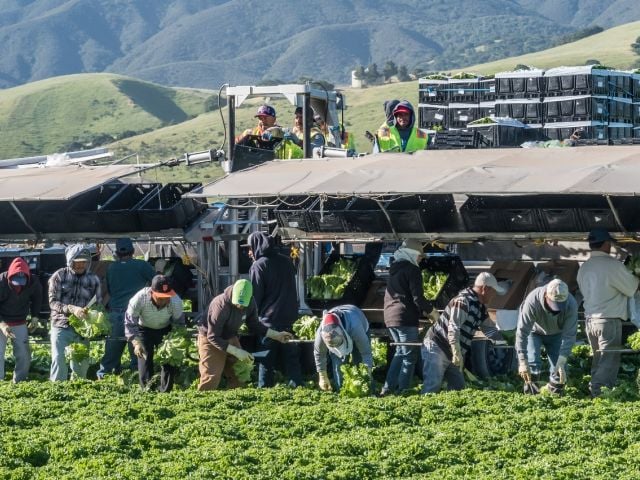
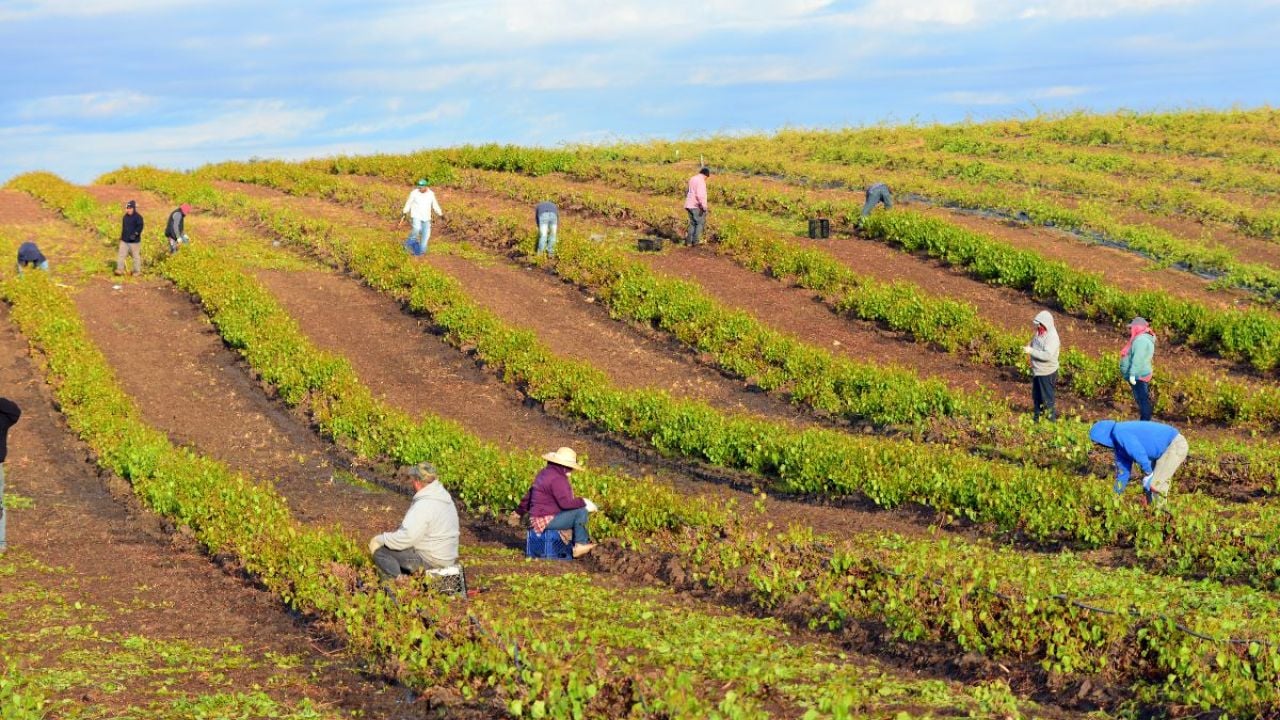
According to the U.S. Department of Labor, 96 percent of farmworkers in California are Latino. Farmworkers are not only exposed to pesticide spray when working in farm fields but are also at risk from pesticide drift entering their homes.
In particular, 70 percent of the sections where paraquat was sprayed were in census tracts where the proportion of residents were Latino was greater than the state-wide average. Almost 80 percent of paraquat sprayed in California was sprayed in these sections.
EWG also found that 65 percent of paraquat used between 2017 and 2021 was sprayed on sections located in low-income census tracts.
The IRS tax code considers communities with poverty rates above 20 percent to be high poverty communities, and communities that have an average income at or below 80 percent of the state’s income to be low-income. California’s median income was $91,905 in 2022, so communities with an average income at or below $73,500 are considered low-income.
The two sections with the greatest paraquat use – one in Kern County and one in Fresno County – were in a census tract where residents were majority Latino and low income. Disadvantaged communities, like those with high poverty rates or low incomes, are often disproportionately impacted by environmental health pollutants throughout the U.S., including in California.
Figure 2. The one-mile section with the most paraquat spray in Fresno County, between 2017 and 2022.
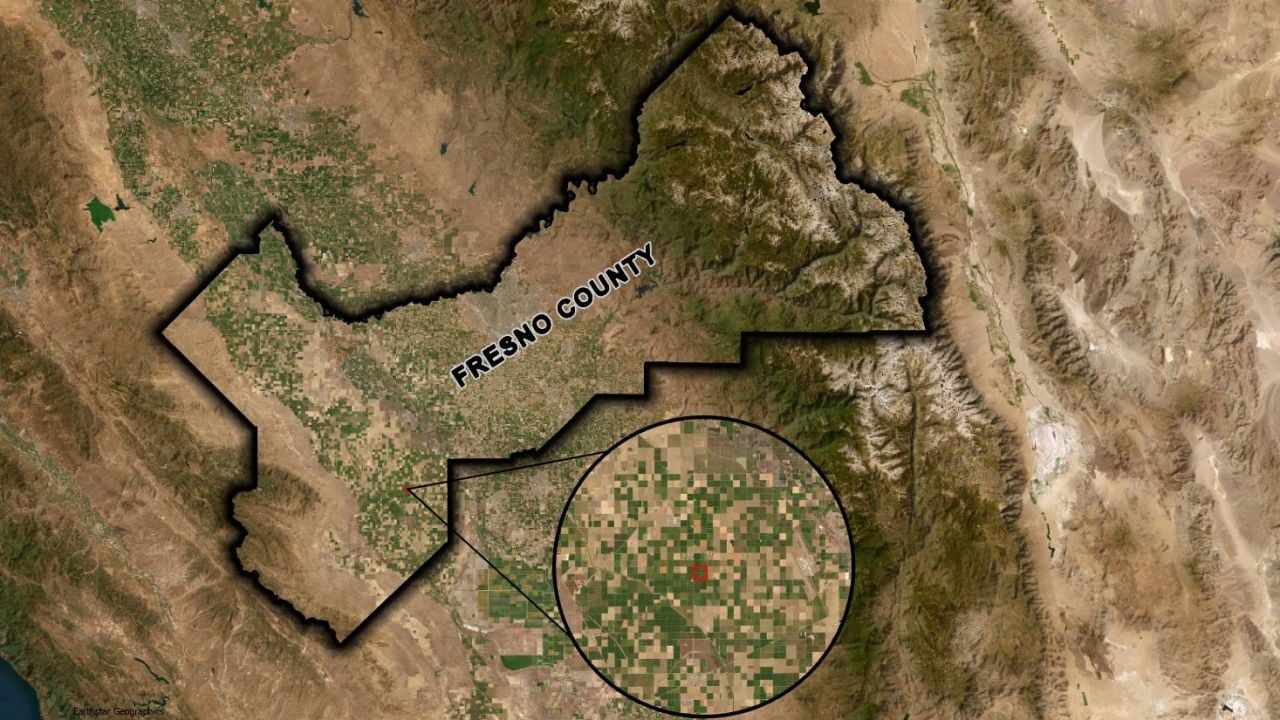
Source: EWG, image from Earthstar Geographics
The Kern County section ranked third among all sections in California for paraquat use and had a poverty rate of 29 percent; the Fresno County section ranked ninth and had a poverty rate of 54 percent. (See Figure 2.)
Kern County: a paraquat hot spot
Kern County is one of the state’s top agricultural counties, producing fruit and nut crops, like almonds, grapes and pistachios. Other top crops in California that have received the most paraquat spray include alfalfa, cotton, walnuts and pomegranates.
More paraquat was used in Kern County between 2017 and 2021 than any other county in California, totaling 1.2 million pounds. (See Table 2.)
Table 2. Top five counties in California with the most paraquat sprayed between 2017 and 2021.
| County name | Number of sections | Paraquat sprayed (lbs) |
|---|---|---|
| Kern | 1,178 | 1,219,140 |
| Kings | 755 | 972,351 |
| Fresno | 839 | 714,748 |
| Tulare | 839 | 321,225 |
| Merced | 825 | 307,014 |
Source: EWG, from California Department of Pesticide Regulation
Of the 8,143 sections in Kern county, 1,178, or nearly 15 percent, were sprayed with paraquat. (See Figure 3.) Three of the most populous five cities where paraquat was used in California are also in Kern County – Bakersfield, Shafter and Wasco.
Figure 3. Pounds of paraquat applied by section in Kern County.
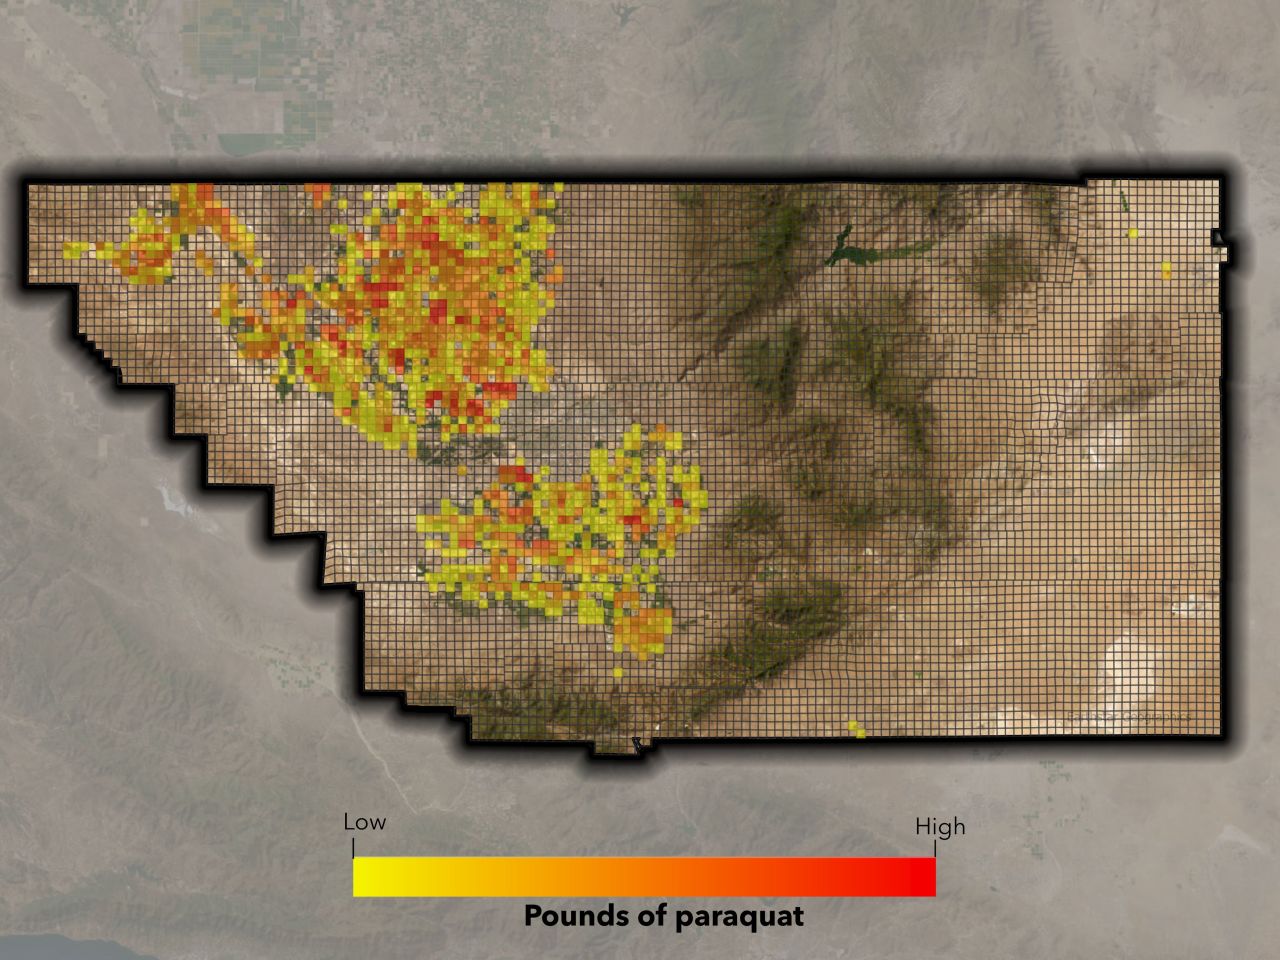
Source: EWG, from California Department of Pesticide Regulation, image from Earthstar Geographics
Kern County also has a much higher proportion of Latino residents – 57 percent compared to the 40 percent of California’s average – than the state-wide average, and the median household in Kern County is well below the state-wide average.
Latino residents are often double exposed to pesticides since many farmworkers are Latino and also live in nearby communities. And low-income communities in the U.S. are also disproportionately impacted by communities that are not low income.
Health risks for Californians
A study from 2024 shows that in California, paraquat exposure at work or at home is associated with Parkinson’s disease. Chronic exposure to paraquat increases the risk of developing Parkinson’s disease by reducing the number of neurons that produce dopamine in certain parts of the brain. Researchers have used paraquat exposure in animals to study Parkinson’s disease.
A study using data from the National Institutes of Health found workers who sprayed paraquat were more than twice as likely to develop Parkinson’s disease as those who applied other pesticides. And a meta-analysis of 13 studies found a 64 percent increase in the likelihood of developing Parkinson’s disease from paraquat exposure.
Most recently, findings from researchers at UCLA show paraquat sprayed within 500 meters, or about 1,640 feet, of where people lived and worked could more than double a person’s odds of developing Parkinson’s.
EWG’s new analysis reveals the widespread use of paraquat throughout the state, and the elevated risks for those Latino, lower-income communities living near fields.
EPA ignores the evidence
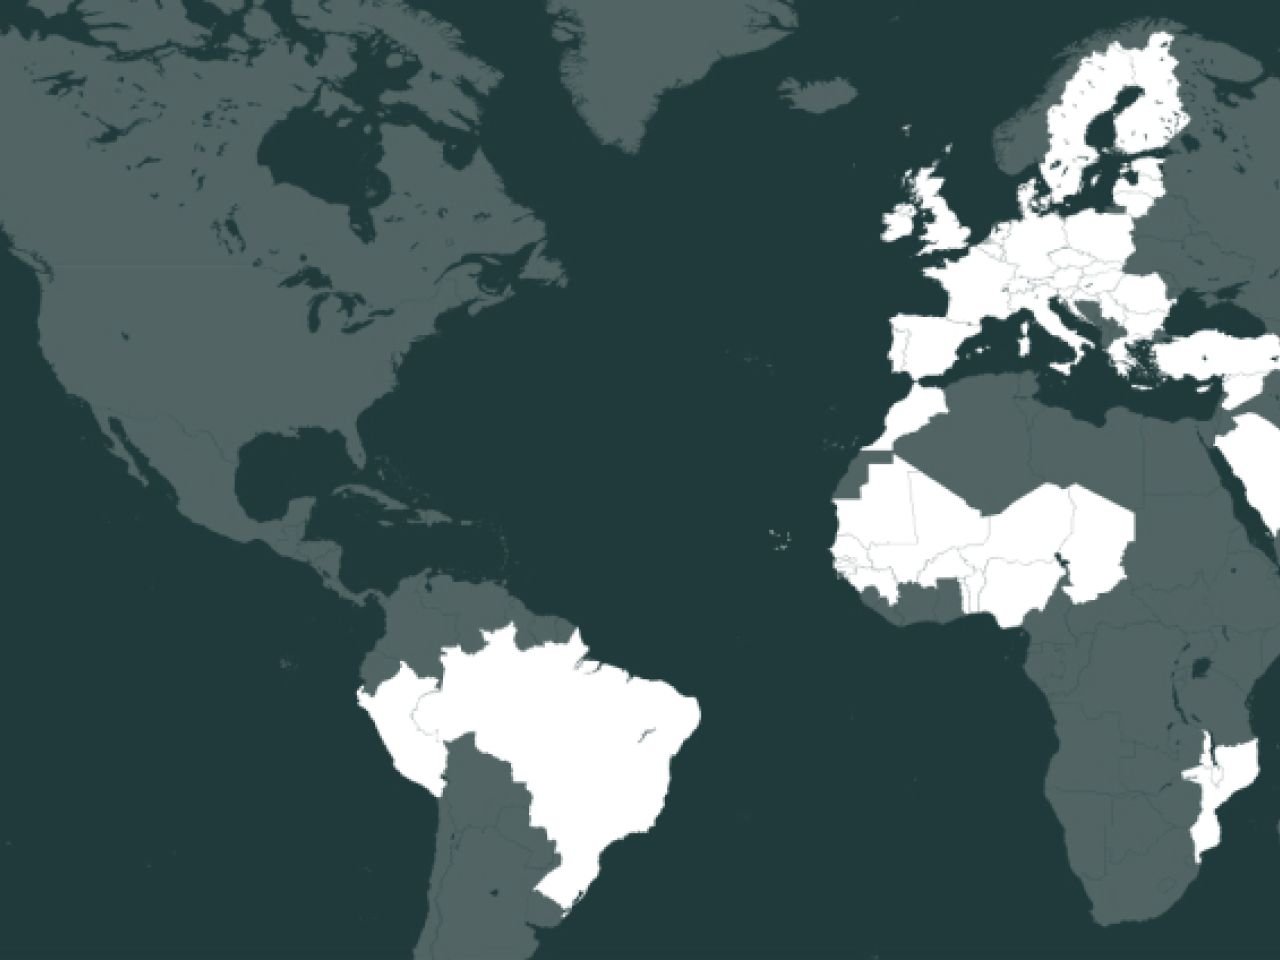
Despite the known risks associated with paraquat – and the fact that dozens of other countries have banned its use – the EPA continues to allow the chemical on crop fields.
Syngenta makes paraquat in China and the United Kingdom. The Swiss-based company, which was acquired by a Chinese state-owned chemical conglomerate, has long understood the chemical’s health risks. But it spent decades hiding this knowledge from the public and the EPA. Ironically, Chinese, U.K. and Swiss farmers are prohibited by their respective governments from using paraquat due to potential health risks from exposure.
The EPA has dismissed research linking paraquat to Parkinson’s disease, including in its latest analysis of the chemical, released last month. This includes new research submitted by the Michael J. Fox Foundation for Parkinson’s Research.
The agency has also failed to consider evidence published by the nonprofit investigative news site The New Lede, which revealed that paraquat’s manufacturer actively sought to mislead EPA regulators about a link between paraquat and Parkinson’s.
And the EPA is also ignoring how people working on farms or living nearby can be exposed to paraquat – ignoring direct drift through the air and underestimating how much can be resuspended in dust. The agency assumes that people spraying paraquat will follow instructions designed to minimize drift and harm. But studies show “off label” use of pesticides is common, with virtually no enforcement.
To fully protect farmworkers and others, the EPA must follow the science and ban the use of paraquat.
But states shouldn’t wait for the agency to act. Federal pesticide law sets a floor, not a ceiling. To protect their citizens and public health, state and local governments have the power to enact measures such as a ban on paraquat.