By EWG’s Science Team
EWG’s analysis of sunscreens includes hazard and efficacy ratings for hundreds of recreational sunscreens and daily-use moisturizers and lip balms with sun protection factors, or SPF. The ratings are based on a compilation of standard industry, government and academic data sources; efficacy models constructed by EWG scientists; and a continuous review of the technical literature on sunscreens.
We based the analysis on sunscreen ingredient listings obtained from direct company submissions; online and brick-and-mortar retailers; and our data partner, Label Insight.
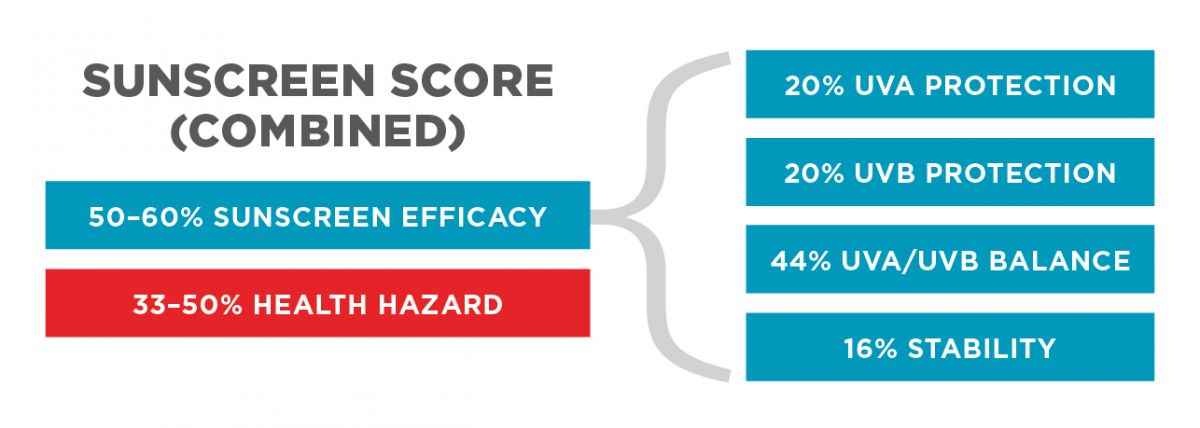
Products are rated on five factors related to total ingredient hazard and efficacy in providing sun protection:
The overall rating for each product was calculated using a formula based on a combination of its health hazard and efficacy ratings. Efficacy accounts for two-thirds of the score for products with lower health hazard concerns and for one-half of the score in products with higher health hazard scores.
In the final product score, EWG has given added weight to other concerning factors:
The methods and content of the analysis are based on EWG’s review of the technical literature, including hundreds of industry and peer-reviewed studies. Results of the analysis appear in EWG’s online, interactive sunscreen guide. Details of the methodology are described below.
Health hazard scores are based on the ingredient health hazard scoring system of EWG’s Skin Deep® database. This core database of chemical hazards, regulatory status and study availability pools data is based on nearly 60 databases from government agencies, industry panels, academic institutions and other credible bodies. The information in Skin Deep is used to create hazard and data gap ratings for both personal care products and individual ingredients.
In addition, the hazard scores for mineral ingredients were adjusted to account for exposure potential calculated using evidence of reduced or limited skin penetration or absorption, as described in greater detail on the Skin Deep “about” page.
We gave added weight in the calculated hazard scores to properties of particular concern for sunscreens. For sunscreens with a single significant concern, we assigned a rating no lower than 3 (moderate hazard), and for sunscreens with two or more significant concerns, we assigned a rating no lower than 7, to reflect a higher level of concern.
Hazard scores in the sunscreen evaluations reflect hazards specific to sunscreens, as well as the beneficial or potentially harmful effects of specific active ingredient combinations. We assessed hazards identified by government, industry and academic sources but did not evaluate specific claims made by individual manufacturers.
This guide includes a closer look at the 16 chemicals permitted by the Food and Drug Administration for use as active ingredients in sunscreens – including the particle sizes of the inorganic, or mineral, sunscreen ingredients zinc oxide and titanium dioxide. We compiled relevant information from sources that included the peer-reviewed literature and risk assessments from the European Union, Japan and Australia, and other countries with robust sunscreen regulations.
Sunscreens sold in the U.S. are considered over-the-counter drugs. They contain active ingredients that must be tested for safety and efficacy, and inactive ingredients that – as with virtually all other personal care products – do not require safety tests. We used different approaches to evaluate active and inactive ingredients.
Active ingredients, as well as specific active ingredient combinations, were evaluated based on an extensive review of the scientific literature. The review included peer-reviewed literature, filed and approved patents, and reviews by government and industry panels, as well as cross-checks with EWG’s Skin Deep database.
We assessed inactive ingredients using the Skin Deep database, which identifies chemicals that may pose health hazards. These include:
Skin Deep assessments also highlight the extensive data gaps that exist for most ingredients in cosmetics and personal care products.
Briefly, EWG’s hazard ratings are a synthesis of known and suspected hazards associated with ingredients and products. Skin Deep categorizes hazard ratings as low, moderate or higher concern, with numeric rankings from 1, or low concern, to 10, or high concern. Data gap ratings describe the extent to which ingredients or products have been definitively assessed for hazards.
Further details concerning this methodology may be found on the Skin Deep website.
In the analysis of product effectiveness, we weighed four factors:
We assigned a score for each factor based on an evaluation of the labeled SPF, EWG-modeled UV protection and the technical literature on sunscreen stability.
We derived an overall rating for product effectiveness as the sum of these four factors, weighted by their relative importance. In this calculation we assigned a weight of 0.20 each to UVA protection and UVB protection, a weight of 0.40 to UVA/UVB balanced protection, and a weight of 0.16 to stability. The procedures are described in greater detail below.
A product’s SPF rating, as stated on the label, determines its UVB protection.
UVB protection from sunscreens with SPF values between 15 and 110 are effective for sunburn protection and receive a score of 0. The score is based on the assumption that consumers would pick a product with the appropriate SPF based on their skin tone, and time spent outdoors and the sun’s intensity.
When EWG modeling showed that the SPF value of a product was less than half its labeled value, we added three points to the product’s overall score, because of concerns about the efficacy of the product and the likely use of inactive ingredients to boost the SPF value.
EWG is concerned that SPF boosters are becoming more common in U.S. sunscreens. Many inhibit sunburn but do not appear to change the absorbance spectrum of sunscreen – they do not prevent UV rays from striking the skin. There are serious, unanswered questions about whether these ingredients protect the skin from other types of UV damage.
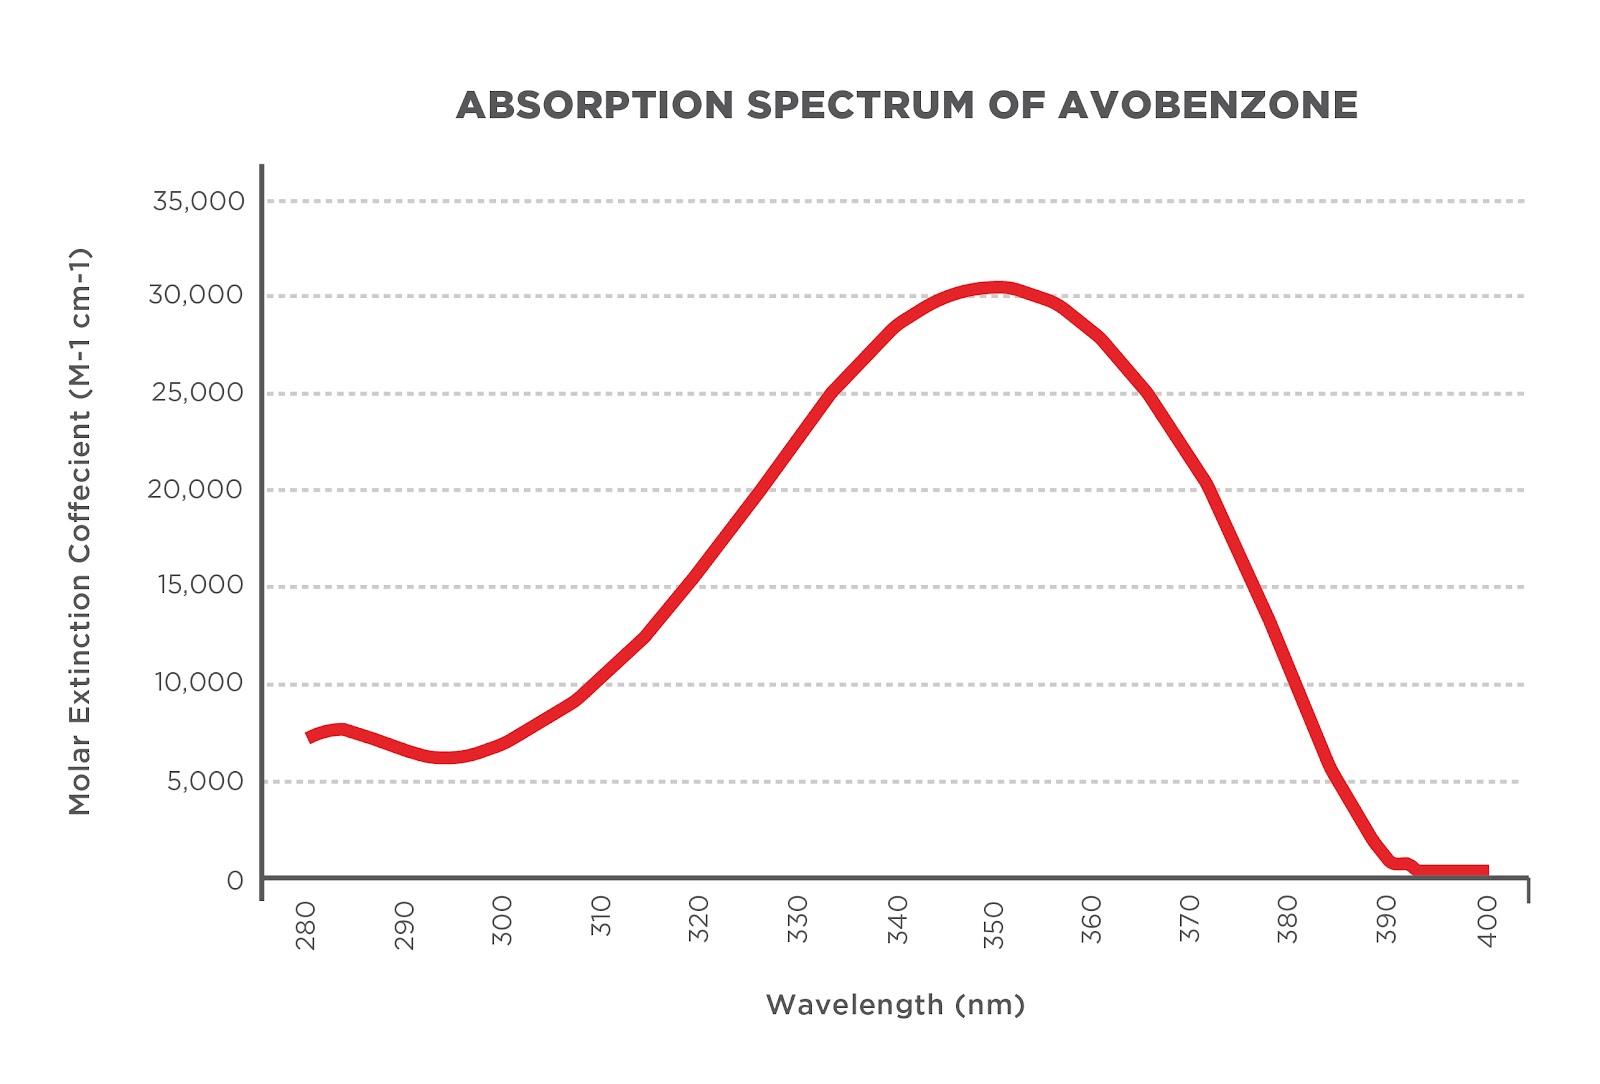
To score products on UVA protection (Section 2) and the balance of UVA to UVB protection (Section 3), we modeled the sunscreen’s effectiveness on the basis of the active ingredients. Modeling the efficacy of sunscreen products based on the active ingredients is standard industry practice. Modeling requires the absorbance spectrum for the active ingredient and the percent of the active ingredient used in the product.
To determine absorbance spectra researchers measure the amount and type of UV light filtered out by an ingredient or ingredient combination at every wavelength along the UVA and UVB spectrum. With absorbance spectra, researchers determine the theoretical effectiveness of sunscreen ingredients and sunscreen products in preventing UV radiation from reaching the skin.
Figure 1. Example of modeled absorption spectrum of avobenzone
|
Ingredient |
Source |
|
4-methylbenzylidine camphor (4-MBC) |
|
|
Avobenzone (Parsol 1789 | butyl methoxydibenzoylmethane) |
|
|
Ethylhexyl triazone |
|
|
Ensulizole (phenylbenzimidazole sulfonic acid) |
|
|
Homosalate |
|
|
Menthyl anthranilate (Beeby and Jones 2000) |
|
|
Mexoryl SX |
|
|
Sunscreen-grade titanium dioxide |
|
|
Sunscreen-grade zinc oxide |
(Schlossman 2005, EWG 2021 , BASF 2024 ) |
|
Octinoxate (octyl methoxycinnamate) |
|
|
Octisalate (octyl salicylate) |
|
|
Octocrylene |
|
|
Oxybenzone (benzophenone-3) |
|
|
Padimate O (octyl dimethyl PABA | PABA ester) |
|
|
Polysilicone-15 |
|
|
Sulisobenzone (benzophenone-4) (CIR 2006) |
|
|
Tinosorb M (MBBT) |
|
|
Tinosorb S |
Monochromatic protection factor and transmission spectra for ingredients and products
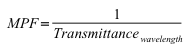
Both SPF and monochromatic protection factor, or MPF, are unitless factors that measure the UV radiation blocked by sunscreen. SPF is a single value, whereas MPF varies according to wavelength.
In the U.S., sunburn experiments on human volunteers determine the SPF. MPF is derived from lab measurements of UV transmission. SPF can also be computed by combining the MPF spectrum with the effective action spectrum for sunburn, a measure of how much damage a particular wavelength of light will cause.
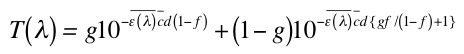
The MPF measures the amount of UV radiation blocked – that is, absorbed or scattered – at a particular wavelength. And it’s key to EWG’s evaluation of sunscreen effectiveness. We developed UV transmission spectra for individual active ingredients and for all combinations of active ingredients in the products assessed. Our report uses the MPF transmission spectrum to graphically represent the effectiveness of sunscreen products and ingredients across the UV spectrum and to calculate the effectiveness of products in the UVA range. In the UVB range, we use SPF instead of MPF as the measure of product effectiveness.
We computed the MPF transmission spectra following the method detailed by Herzog and implemented by the BASF sunscreen simulator, formerly known as the Ciba sunscreen simulator. This model accounts for the effect of uneven skin surfaces – skin is not a smooth surface but a series of ridges and valleys. The model represents sunscreen on the skin as an unevenly distributed thin film. The sunscreen thickness is modeled using a continuous height distribution that matches a gamma distribution function. The gamma method significantly improves calculated correlation with measured SPF over the previously used two-step model.
MPF is given by:
where T is the percent transmission of light; ε(λ) is the average molecular absorption coefficient (as defined by Herzog); c is the average molar concentration of the active ingredients in moles/liter; d is the path length (20 micrometers is the assumed thickness of sunscreen based upon the recommended applied dose of 2 mg/cm2); and g and f are parameters fitted by Herzog to match experimental data on European sunscreens equaling 0.269 and 0.935, respectively. Once the transmission spectrum is obtained, it can be transformed into an absorbance spectrum and MPF.
We used this method to compute the UV transmission spectra both for individual ingredients and for all variations of active ingredients in the products assessed. The method requires entering the concentrations of active ingredients. In computations of MPF spectra for individual ingredients, we used the average concentration of that ingredient found in the products assessed. In computations of MPF spectra, we used the concentrations of active ingredients specified on the product label.
We evaluated sunscreen effectiveness partly on the basis of our computation of the transmission spectrum for a product’s combination of active ingredients. We integrated the combined effective absorbance spectrum, as described by Herzog, over 1 nanometer, or nm, wavelength intervals to obtain overall sunscreen product spectra based on the individual ingredient spectra described above.
Sunscreen formulated without zinc oxide generally contains multiple active ingredients to achieve both UVA protection and adequate SPF.
In evaluating total UVA protection effectiveness, we use our modeled spectrum for the product to calculate the percentage of UVA absorbed. This calculation provides a numeric measure of the degree of UVA protection. We calculated this value by integrating the MPF between 320 to 400 nm.
Using this method, we assigned a score to each product. (See Table 1.)
Table 1. UVA score and percent of UVA light blocked
|
Percent UVA blocked or absorbed |
UVA protection score |
|
>=93.6% |
0 |
|
>=92.0% |
1 |
|
>=90.0% |
2 |
|
>=87.5% |
3 |
|
>=84.4% |
4 |
|
>=80.0% |
5 |
|
>=75.0% |
6 |
|
>=68.8% |
7 |
|
>=60.0% |
8 |
|
<60.0% |
9 |
3. Calculating UVA/UVB protection balance
Government agencies, sunscreen researchers and the American Association of Dermatology recognize the need for sunscreens to offer proportionate protection from UVA and UVB radiation.
The method we use to evaluate the balance of protection is based on the ratio of our modeled UVA protection factor, or UVA-PF, to the labeled SPF. This method better accounts for imbalance, particularly in the high-SPF range, and relies directly on manufacturers’ measured SPF values, rather than modeled values.
We calculated a balance factor for each sunscreen as the ratio of the UVA-PF for persistent pigment darkening to the SPF value listed on product labels.
Using this method, we assigned a UVA/UVB balance score to each product:
Table 2. UVA/UVB balance score
|
Ratio of UVA-PF/SPF |
UVA/UVB balance score |
|
>90% |
0 |
|
>66% |
1 |
|
>33% |
2 |
|
>29% |
3 |
|
>25% |
4 |
|
>21% |
5 |
|
>16% |
6 |
|
>14% |
7 |
|
>11% |
8 |
|
<11% |
9 |
Calculating the number of sunscreens that meet the UVA standard set by Cosmetics Europe
The European standard for UVA protection in sunscreens set by Cosmetics Europe requires they have both a critical wavelength of 370 nm and a ratio of UVA-PF to SPF greater than 1 to 3. The UVA protection factor is calculated by weighting the absorbance spectrum between 320 and 400 nm with the persistent pigment-darkening action spectra.
The FDA standard for broad spectrum protection
Beginning in 2012, sunscreens sold and labeled as providing broad-spectrum protection have been required to have a critical wavelength of 370 nm. The FDA standards do little to differentiate mediocre from excellent products. The standards have been criticized for providing no incentive for improvement.
The proposed FDA standard for UVA protection
In 2019 the FDA proposed an updated standard for UVA protection. The proposal was blocked by language in the 2020 CARES Act, but a proposed final order for sunscreens was issued in 2021. The proposed new rules require that sunscreen products have a ratio of UVA/UV protection of 0.7 or greater and are based on a 2007 FDA proposal that did not pass. This standard is an improvement but fails to ensure that the UVA protection increases with increasing SPF. On each product page, we include a top finding showing whether our modeling predicts that the product would pass the proposed FDA test.
UV light absorption causes many sunscreen active ingredients to develop chemical reactions or structural changes on the skin. In most cases, these ingredients revert quickly to their original form to absorb more energy.
But ingredients can also degrade and in some cases even lose their UV protectiveness. One study found that seven of 14 common sunscreens in Europe photodegraded significantly after exposure to UV radiation, specifically UVA radiation.
In certain cases, degradation may produce other chemicals toxic to skin and body cells, especially if the sunscreen has been absorbed into the skin, or the reactions can speed up – or catalyze – degradation of other ingredients in the sunscreen mixture.
EWG would like to review laboratory results of photodegradation for every active ingredient in every sunscreen product. But since this information is not publicly available, and such tests are not required of manufacturers, we analyzed many studies from various sources. In quantifying these studies, we found it challenging to compare results because of differences in the experimental conditions, such as solvent versus sunscreen formulation, measurement of light energy and sample preparation.
And the degradation rate of an ingredient in a dilute laboratory solvent such as water or ethanol may or may not be representative of a consumer’s use. Even results in one sunscreen formulation may not represent the results in another because of variations in the behavior of active ingredients in different environments.
EWG performed linear regression analyses of percent photodegradation (after 2 hours of peak intensity sun exposure, or 10 MEDs) versus minimal erythemal dose (the minimal amount of UV radiation that will produce skin redness or sunburn) exposures in solvent and sunscreen formulations. The regression equations for solvent and sunscreen systems were then weighted equally and classified into three categories:
We weighted solvent and formulation results equally because of the wide variation in test conditions and the possibility that a single sunscreen formulation might not be representative of other formulations.
There is not enough information in the literature about photostability to reliably guide a sunscreen formulator, let alone the consumer. Our classifications are presented in Table 3.
Table 3. Degradation of active ingredients
|
Active ingredient |
Classification percent |
Degradation with exposure to 10 MEDs |
|
4-Methylbenzylidine camphor (4-MBC) (Deflandre 1988; Vanquerp 1999 ) |
None |
Less than 1 |
|
Avobenzone (Parsol 1789 | butyl methoxydibenzoylmethane) (Deflandre 1988; Shaath 1990 ; Roscher 1994 ; Schwack 1995 ) |
Major |
42.1 |
|
Ensulizole (phenylbenzimidazole sulfonic acid) (Deflandre 1988, Serpone 2002 ). Deflandre found insignificant degradation in a sunscreen formulation. Serpone measured fast degradation in various solvents |
Major |
46.6 |
|
Homosalate (Berset 1996, Herzog 2002 ) |
Minor |
6.7 – 60 |
|
Menthyl anthranilate (Beeby 2000) |
None |
No degradation |
|
Mexoryl SX (TDSA) (Deflandre 1988, Cantrell 1999 , Herzog 2005 ) |
Minor |
21.2 |
|
Micronized titanium dioxide (Schlossman and Shao 2005) |
None |
No degradation |
|
Micronized zinc oxide (Schlossman and Shao 2005) |
None |
No degradation |
|
Octinoxate (octyl methoxycinnamate) (Deflandre 1988, Shaath 1990, Berset 1996 , Chatelain 2001 , Serpone 2002 ) |
Minor |
24.8 |
|
Octisalate (octyl salicylate) (Shaath 1990, Bonda 2005 ) |
None |
3.3 |
|
Octocrylene (Shaath 1990, Bonda 2005 ) |
None |
1.6 |
|
Oxybenzone (benzophenone-3) (Deflandre 1988, Shaath 1990, Roscher 1994 , Berset 1996 , Chatelain 2001 , Serpone 2002 ) |
Minor |
21.9 |
|
Padimate O (octyl dimethyl PABA | PABA Ester) (Deflandre 1988, Serpone 2002 ) |
Major |
44.7 |
|
Sulisobenzone (Benzophenone-4) (CIR 2021) |
None |
No degradation expected |
|
Tinosorb M (MBBT) (Herzog, 2002, Herzog 2005 ) |
None |
1 |
|
Tinosorb S (BEMT) (Chatelain 2001, Bonda 2005 , Damiani 2007 ) |
None |
1 |
To account for a situation in which an individual ingredient may photodegrade but the sunscreen itself continues to provide significant protection due to the presence of other active ingredients, we assumed that the UV-blocking effectiveness of an active ingredient experiencing major degradation is reduced by 50 percent, and the UV-blocking effectiveness of an active ingredient with minor degradation is reduced by 25 percent.
We then reintegrated over the entire spectrum and compared the degraded spectrum to the original. UVA and UVB protection were weighted equally. Based on the relative amount of degradation, the following scores were applied separately to the UVA and UVB portions. (See Table 4.)
Table 4. Stability score and percent of UV light blocked
|
Percent blocking after 10 MED |
Score |
|
% area > 90% |
0 |
|
80 < % area < 90% |
1 |
|
70% < % area < 80% |
2 |
|
60% < % area < 70% |
3 |
|
% Area < 60% |
4 |
Menthyl anthranilate and padimate O fluoresce when exposed to sunlight – they absorb energy in the UVB range and re-emit it in the UVA range. If an active ingredient fluoresces, we increased the stability score by one point.
The scores for UVA, UVB and fluorescence were combined to determine the overall stability score, which ranged from 0 to 9, and were then scaled to a range of 0 to 10.
Several inactive ingredients help prevent sun damage through mechanisms other than blocking UV rays. For example, a variety of antioxidants scavenge free radicals in cells. In some cases, claims made for these ingredients are unregulated, whereas in others, the SPF itself can no longer be predicted by the sun-blocking ability of the active ingredients alone. In the latter case, consumers are misled into believing they are receiving more protection than they actually are. For these ingredients, we attenuate the UVA and UVB scores. (See Table 5.)
Table 5: Antioxidant scoring adjustments
|
Raw score |
Score category |
Description |
|
Attenuating score (improves UVB score by 10%) |
Additional protection against UVB-induced damage |
Antioxidants protect against UVB-induced radiation damage |
|
Attenuating score (improves UVA score by 10%) |
Additional protection against UVA-induced damage |
antioxidants protect against UVA-induced radiation damage |
Assumptions about particle size in mineral sunscreens
The absorbance spectra for titanium dioxide and zinc oxide vary according to the size of the particle. Companies are not required to provide particle-size information on package labels. So EWG has little information to use in determining the size and properties of the specific mineral ingredients used.
EWG based the absorbance spectra on an average of the most likely particle sizes found in products containing titanium dioxide and zinc oxide. The information was based on our review of particle size and surface coatings for zinc oxide and titanium dioxide found on the company websites of sunscreen manufacturers and formulators.
Titanium dioxide
When the shortest dimension of the primary particles of titanium dioxide is 15 nm, it appears transparent on skin, but at 35 to 60 nm, it becomes opaque. All information we have amassed from about 10 different titanium dioxide suppliers indicated primary particle sizes of 10 to 35 nm.
Without clear regulatory guidelines, manufacturers and product formulators can claim they are or are not using nanoparticles without proof. We assume all UV-attenuation-grade titanium dioxide have a mean primary particle size of 15 to 35 nm in the shortest dimension.
Table 6: Characteristics of sunscreen-grade titanium dioxide
|
Supplier |
Product |
Crystal form |
Primary particle size |
Surface coating |
Source |
|
BASF |
T-Lite SF-S |
Rutile |
30 nm*60 nm*10 nm, may aggregate into larger particles |
Methicone |
|
|
BASF |
T-LITE SF |
Rutile |
30 nm*60 nm*10 nm, may aggregate into larger particles |
Silica, methicone |
|
|
BASF |
Uvinul TiO2 |
75% anatase/25% rutile |
21 nm, agglomerate to 100 nm |
trimethoxyoctysilyl |
|
|
Degussa |
P-25 |
Anatase |
21 nm |
None, trimethyloctylsilane |
|
|
EMD, Rona/Merck |
Eusolex T-2000 |
Anatase |
10 to 20 * 100 nm (possibly due to agglomeration) |
Alumina, dimethicone |
|
|
EMD, Rona/Merck |
Eusolex T-45D |
Anatase |
10-15 nm |
Alumina/simethicone, oil dispersion |
|
|
EMD, Rona/Merck |
Eusolex T-AQUA |
Anatase |
10-15 nm |
Alumina, water dispersion |
|
|
ISK |
TTO S-4 |
Rutile |
15 nm |
AHSA |
|
|
ISK |
TTO S-3 |
Rutile |
15 nm |
Alumina |
|
|
ISK |
TTO V-3 |
Rutile |
10 nm |
Alumina |
|
|
Kemira |
UV Titan M170 |
Rutile |
14 nm |
Alumina, methicone |
|
|
Kemira |
UV Titan M262 |
Rutile |
20 nm |
Alumina, dimethicone |
|
|
Kobo Products |
TTO-NJE8 |
At least one dimension >100 nm |
Alumina and jojoba esters |
||
|
Sachtleben |
Hombitec L5 |
Anatase |
est. 15 nm (80-160 m2/g) |
Silica, silicone |
|
|
Showa Denka |
Maxlight TS-04 |
35 nm |
Silica |
||
|
Tayca |
MT-100T |
Rutile |
15 nm |
AS/AH |
|
|
Tayca |
MT-500B |
Rutile |
35 nm |
Alumina |
|
|
Tayca |
MT-100Z |
Rutile |
15 nm |
AS/AH |
|
|
Titan Kogyo |
Stt 65C-S |
Anatase |
est. 20 nm (64 m2/g) |
None |
Zinc oxide
Scientists estimate zinc oxide provides maximum UVB protection with particles size 20 to 30 nm, and the typical size of zinc particles in sunscreen is 30 to 200 nm. Smaller particles provide greater UVB but less UVA protection than larger ones. Particles larger than about 200 to 300 nm tint the skin white and are unacceptable to most consumers.
By default, EWG has assumed that as an active ingredient in sunscreen, it has a 140 nm mean primary particle size. The absorbance spectra for zinc oxide was also adjusted to more closely match the results of our tests of common zinc oxide–based sunscreens.
Table 7: Characteristics of sunscreen-grade zinc oxide by brand
|
Supplier |
Product |
Primary particle size |
Surface coating |
Source |
|
Antria/Dow |
Zinclear-IM 50AB |
2740 nm |
C12-15 Alkyl Benzoate (and) Isostearic Acid (and) Polyhydroxystearic Acid |
|
|
Antria/Dow |
Zinclear-IM 50CCT |
2740 nm |
Caprylic/Capric Triglyceride (and) Glyceryl Isostearate (and) Polyhydroxystearic Acid |
|
|
Antria/Dow |
Zinclear-IM 50JJ |
2740 nm |
Simmondsia Chinensis (Jojoba) Seed Oil (and) Glyceryl Isostearate (and) Polyhydroxystearic |
|
|
Antria/Dow |
Zinclear-IM 55L7 |
2740 nm |
Neopentyl Glycol Diheptanoate (and) Glyceryl Isostearate (and) Polyhydroxystearic Acid (and) Cetyl PEG-PPG-10/1 Dimethicone |
|
|
BASF |
Z-Cote |
80 nm (30 to 200 nm) |
uncoated or dimethicone |
|
|
Elementis |
Nanox 200 |
60 nm (17 m2/g) |
None |
|
|
Kobo Products |
ZnO-C-12 |
At least one dimension > 100 nm |
Isopropyl Titanium Triisostearate |
|
|
Kobo Products |
ZnO-C-11S4 |
At least one dimension > 100 nm |
Triethoxycaprylysilane |
|
|
Kobo Products |
ZnO-C-NJE3 |
At least one dimension > 100 nm |
Jojoba esters |
|
|
Kobo Products |
ZnO-C-DMC2 |
At least one dimension > 100 nm |
Dimethicone/Methicone copolymer |
|
|
Sakai |
Finex, SF-20 |
60 nm (20 m2/g) |
None |
|
|
Showa Denka |
ZS-032 |
31 nm |
Silica |
|
|
Sumitomo Cement |
ZnO-350 |
35 nm |
None |
|
|
Tayca |
MZ-700 |
10-20 nm |
None |
|
|
Tayca |
MZ-500 |
20-30 nm |
None |
|
|
Tayca |
MZ-300 |
30-40 nm |
None |