Under Trump, Farm Subsidies Soared and the Rich Got Richer
Biden and Congress Must Reform a Wasteful and Unfair System
By Anne Schechinger, Senior Analyst of Economics
WEDNESDAY, FEBRUARY 24, 2021
Taxpayer-funded farm subsidies have long been skewed in favor of the richest farmers and landowners. But under the Trump administration, even more money went to the largest and wealthiest farms, further shortchanging smaller, struggling family farms.
EWG’s analysis of records from the Department of Agriculture finds that subsidy payments to farmers ballooned from just over $4 billion in 2017 to more than $20 billion in 2020 – driven largely by ad hoc programs meant to offset the effects of President Trump’s failed trade war.
Not only did the amount of subsidies skyrocket, but the richest farms also increased their share: In 2016, about 17 percent of total subsidies went to the top 1 percent of farms and about 60 percent to the top 10th. In 2019, the richest 1 percent received almost one-fourth of the total, and the top 10th received almost two-thirds.1
The staggering growth of subsidies and the worsening inequity in distribution underscore the urgency for the Biden administration and the new Congress to enact commonsense farm subsidy reforms that will benefit small, struggling farmers and the environment and make up for the mistakes of the Trump years.
Traditional Subsidies Are Dwarfed by Ad Hoc Programs
The 2014 Farm Bill established two traditional commodity farm subsidy programs that send payouts to farmers every year. These programs, the Agricultural Risk Coverage program, or ARC, and the Price Loss Coverage program, or PLC, are triggered if crop yields or prices are lower than expected. Farmers can choose to take part in either ARC or PLC for the entire length of each farm bill, typically five years. Not every farm receives payments from these programs every year, but many do, and the programs send out billions of dollars annually.
But even though these existing programs pay farmers for reductions in crop prices, the Trump administration established additional multi-billion-dollar ad hoc subsidy programs – subsidies for specific, limited and supposedly temporary purposes.
- The Market Facilitation Program, or MFP, paid billions to farmers in 2018 and 2019 for losses driven by tariffs that China placed on agricultural imports from the U.S. in retaliation for Trump’s trade war.
- The Coronavirus Food Assistance Program, or CFAP, sent billions to farmers last year. The USDA is still accepting applications for this year, but Biden has ordered a freeze on payments until further notice.
ARC and PLC payments, from their inception in 2014 through 2019, the most recent year of payments, were $32.04 billion. But ad hoc subsidies far exceeded the total payments from those traditional programs in the final two years of the Obama administration and under Trump: a total of $49.08 billion in five years of annual disaster payments, two years of MFP payments and CFAP payments through October of last year.
Altogether, since 2014, ad hoc and traditional subsidy programs cost U.S. taxpayers more than $81.1 billion.
The chart below shows the growth in farm subsidies since 2018, when the MFP began. Since ARC and PLC payments are made in the calendar year after the year the crop was grown, we won’t know the 2020 payments until this fall. So the chart below includes an estimate for 2020 ARC and PLC payments, provided by the Congressional Budget Office.
Farm Subsidy Payments Between Program Years 2014 and 2020
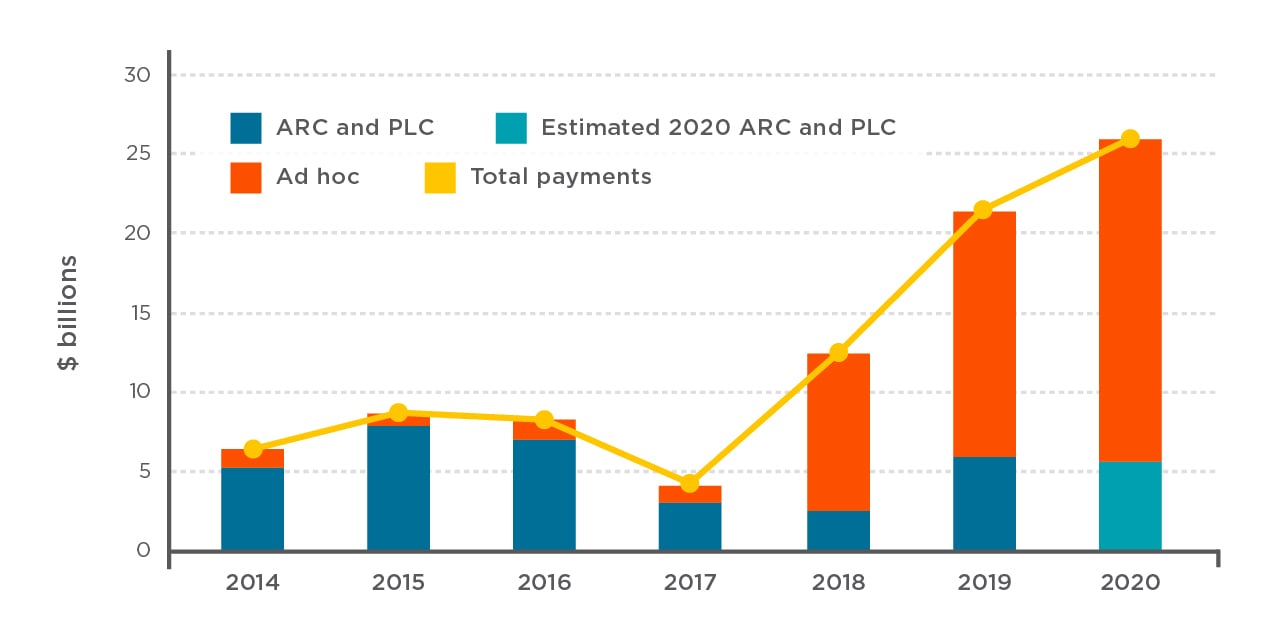
Source: EWG, from data obtained through public records requests to the USDA, and the Congressional Budget Office’s January 2020 Baseline for Farm Programs.
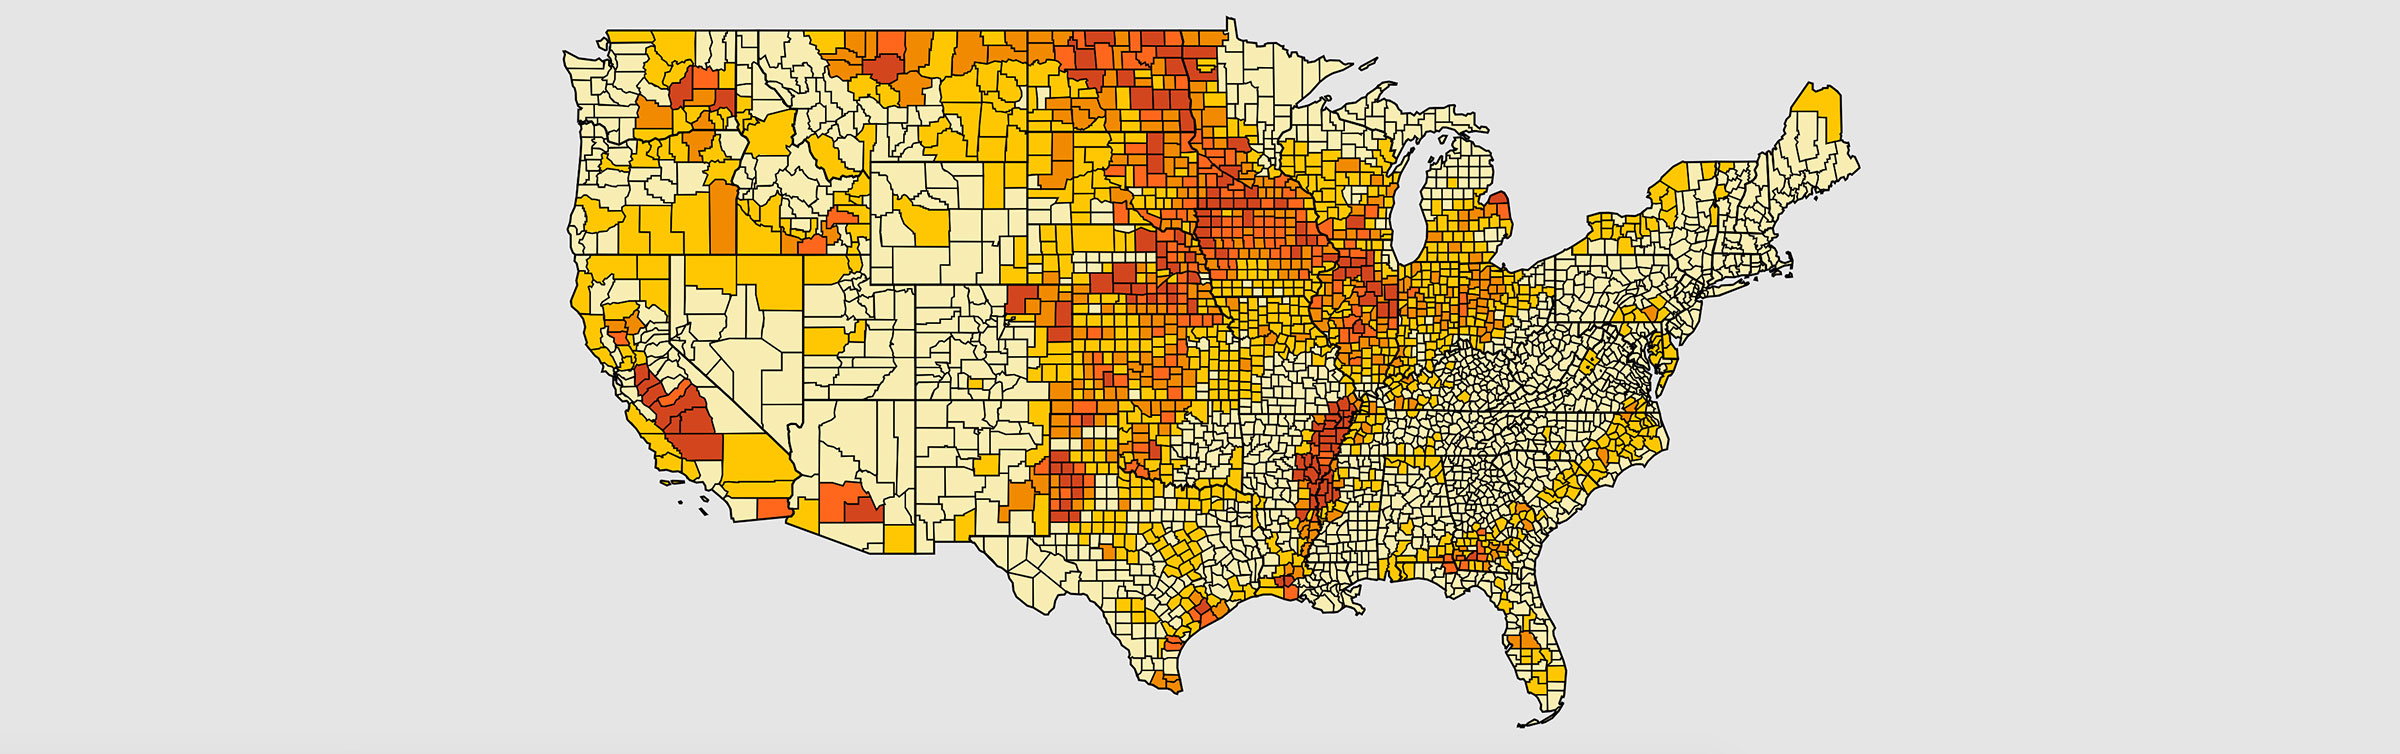
The majority of payments went to just eight states – Illinois, Iowa, Kansas, Minnesota, Nebraska, North Dakota, South Dakota and Texas. Farmers in those states received more than $41 billion, or 51 percent of the total.
The interactive map below shows annual county-by-county subsidy payments since 2014. The 10 counties that received the highest ad hoc payments together received over $1.6 billion.
Explore the Map

The massive outlays of taxpayer dollars aren’t the only cost of wasteful farm subsidies.
Nationwide, nitrate contamination of drinking water – from nitrogen in fertilizer and manure running off farm fields – is a serious and growing health hazard. Analysis of USDA records shows how federal payments are subsidizing farms in counties with severe nitrate contamination.
For example, levels of nitrate in drinking water are especially high in the San Joaquin Valley of California, where communities with majority-Latino populations are the most likely to have high nitrate. Six of the 10 U.S. counties with the highest ad hoc subsidy payments are in the San Joaquin Valley – Fresno, Kern, Kings, Merced, Stanislaus and Tulare, which since 2014 received a total of $1.09 billion from disaster payments, MFP and CFAP.
Yet all of the traditional and ad hoc subsidies outlined above are only a part of the total payments American farmers receive every year. Federal crop insurance – a Depression-era ad hoc program written into law in 1980 – adds billions each year, and tends to pay farmers for the same reductions in crop prices as ARC and PLC. Conservation programs also make payments to farmers every year, but conservation payments are considerably smaller than farm subsidies or crop insurance.
The Largest Farms Get the Most Money
The USDA classifies 98 percent of all U.S. farms as “family farms,” but the top 0.3 percent are considered “very large family farms.” These biggest farms have a gross farm income of at least $5 million and in 2019 provided their operators a median household income of just under $1 million.
As USDA data shows, the great majority of both traditional commodity and ad hoc program payments go to the largest and wealthiest farms, which generally have considerable assets to fall back on in lean years. Small farms that struggle when crop prices are low or during the pandemic-triggered economic crisis get only a small portion of payments. It’s no accident: The programs are designed so that farms with the largest acres or crop production get the highest payments.
For example, through the MFP in 2018 and 2019:
- The top 1 percent of recipients received 16 percent of payments, with an average total payment for both years of $524,298 per farm. The top 10 percent received 58 percent of payments, with an average total payment of $185,340.
- The bottom 80 percent of recipients received only 23 percent of payments – an average payment for both years of only $9,109 per recipient.
The ARC, PLC and CFAP programs had very similar payment concentrations. But compared to other Americans, do farmers need all this money?
In December, the USDA’s Economic Research Service forecast that when all data for 2020 is in, the median income for all farm households is expected to be $86,992. That’s almost 25 percent more than the 2019 median household income for all U.S. households of $69,703.
Just looking at income from farming, the huge ad hoc payments of recent years have made subsidies a large chunk of total farm income.
Between 2019 and 2020, total direct government payments to farms increased by over 107 percent, bringing the share of farm income from government payments to almost 40 percent. As the graphic below shows, that pushed 2020 farm income levels significantly above the 20-year average.
Net Farm Income, 2000-2020
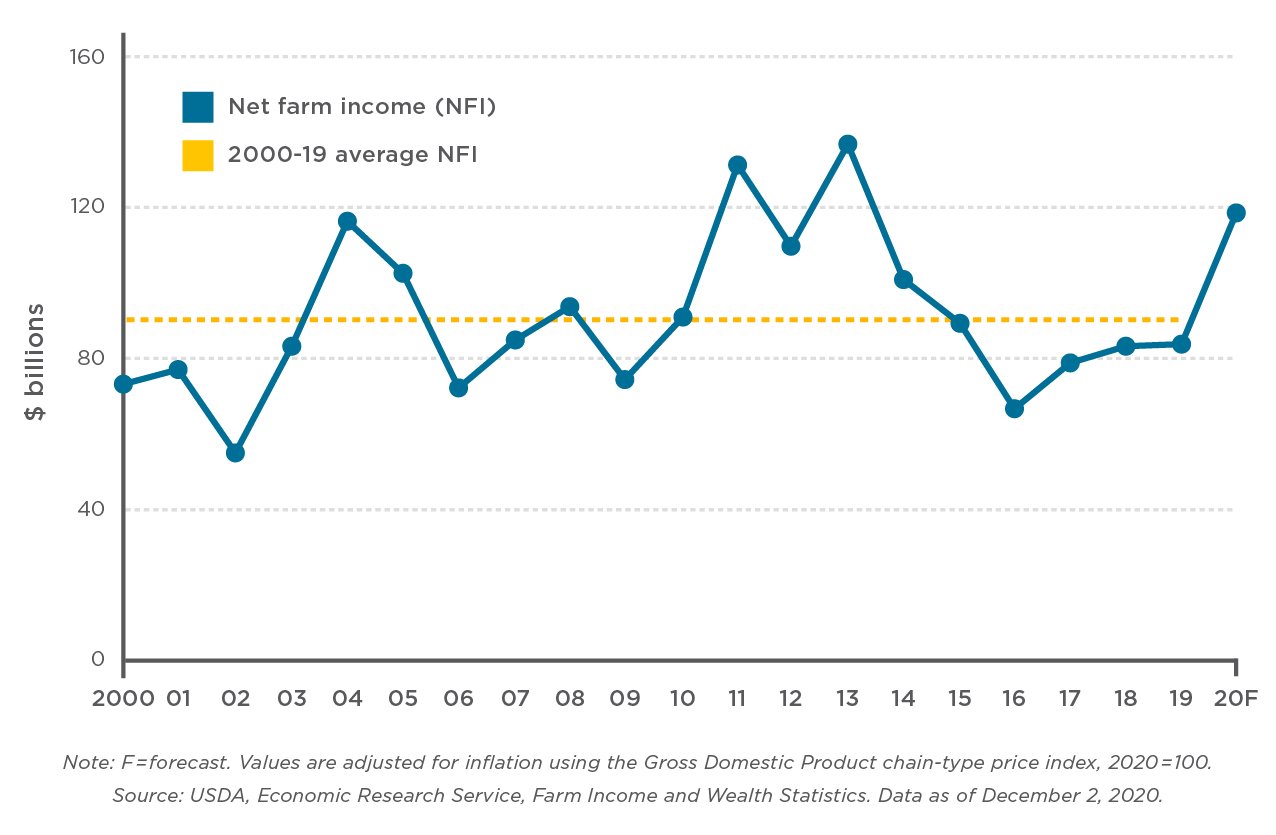
Source: EWG, from USDA Economic Research Service, 2020 Farm Sector Income Forecast
It’s clear that even most “small” farmers are better off than the average American – in 2019, only 3 percent of all farm households had levels of wealth that were lower than the average U.S. household.
Yet during the pandemic and economic crises of last year, when millions of Americans lost their jobs, had to close their small businesses and struggled to put food on the table, taxpayers sent over $20 billion to farmers through CFAP, plus annual disaster payments. (Like other subsidies, CFAP payments went disproportionately to the largest and richest farms, rather for direct aid to hungry Americans.) And that’s before we know the figure for payments through ARC and PLC.
How To Fix the Broken Farm Subsidy System
The Biden administration and the new Congress have many opportunities to fix the traditional commodity farm subsidy programs of ARC and PLC, and to shift funding for the ad hoc programs into conservation programs that benefit farmers, all Americans and the environment. EWG recommends:
- Ending the huge ad hoc subsidy programs of the Trump administration. MFP, which paid out over $23 billion in 2018 and 2019, should not be renewed. CFAP is still making payments to farmers, but when those payments are complete, it should not be renewed unless targeted to small farmers in need.
- Increasing funding for conservation programs. Instead of sending billions to the largest and wealthiest farms, funding for existing conservation programs should be increased. These programs still give money to farmers, but they also generate public health and environmental benefits through improved water quality and soil health. These programs also encourage the adoption of conservation practices that may reduce greenhouse gas emissions.
- Reforming traditional commodity farm subsidy programs. The ARC and PLC programs need a strict means test to stop most of the payments from going to the largest farms. Currently, farmers can receive payments as long as their income is less than $900,000 a year, or $1.8 million for a farmer and spouse. There is a $125,000 annual payment limit, but a farm can have an unlimited number of “partners” that can each receive up to $125,000, allowing many people who do not live or work on the farm to get a check every year. Restricting farms to just a few eligible managers could greatly reduce the number of city slickers who get payments.
- Changing farm subsidy programs to end USDA’s racist legacy. Stricter payment and income limits that would send payments to small farms, instead of the largest farms, would benefit Black, Latino and Asian American farmers, who often own smaller farms than white farmers do.
Footnotes:
1 EWG has yet to receive USDA data needed to compute the distribution of subsidies for all of 2020. Through June, the breakdown was 23.7 percent to the top 1 percent and 64.3 percent to the top 10th.