Back to National Report
Nitrate in Drinking Water, 2003-2017: Wisconsin
Between 2003 and 2017, tests detected elevated levels of nitrate (3 milligrams per liter, or mg/L) in the tap water supplies of 303 towns and cities in Wisconsin, serving approximately 1.1 million people.
Contamination is getting worse in 165 of those community water systems1 – 54 percent, serving approximately 425,000 people. Those 165 Wisconsin communities where contamination is increasing rely entirely on groundwater for drinking water.
Wisconsin Communities With Increases in Nitrate Contamination, 2003 to 2017
Explore the Map

Source: EWG, from Wisconsin Department of Natural Resources data.
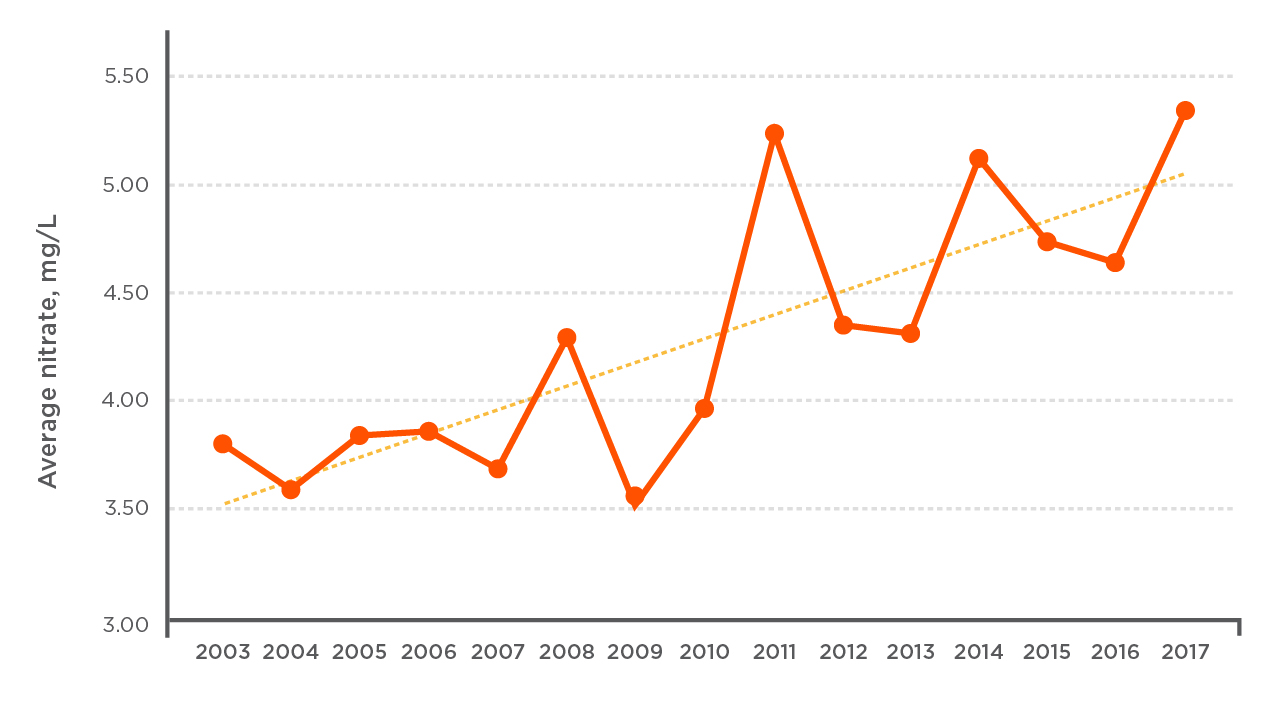
Average nitrate contamination across these communities jumped by 46 percent between 2003 and 2017. In 2003, average contamination was 3.80 mg/L. By 2009, average contamination had decreased to 3.57 mg/L but then climbed to 5.34 mg/L in 2017.
Average Nitrate Levels in Wisconsin Communities Where Contamination Rose, 2003 to 2017
Source: EWG, from Wisconsin Department of Natural Resources data.
Health Hazards of Nitrate
Nitrate is a primary chemical component of fertilizer and manure that can run off farm fields and seep into drinking water supplies. Under the federal Safe Drinking Water Act, the legal limit for nitrate, measured as nitrogen, in drinking water is 10 mg/L. This limit was set in 1962 to guard against so-called blue baby syndrome, a potentially fatal condition that starves infants of oxygen if they ingest too much nitrate.
But more recent studies show strong evidence of an increased risk of colorectal cancer, thyroid disease and neural tube birth defects at levels at 5 mg/L or even lower. During the period analyzed, drinking water was getting worse in 96 Wisconsin communities, serving approximately 303,000 people, that already had tested at or above 5 mg/L at least once.
Drinking water for approximately 59,000 of those people, in 21 communities, had already tested at or above the Environmental Protection Agency’s legal limit at least once and had increasing nitrate levels during the period analyzed. Of the 51 communities where nitrate exceeded the federal legal limit at least once, 11 systems, serving approximately 8,000 people, tested at or above the legal limit.
People who want to know the level of nitrate in their community’s water system can visit the Wisconsin page of EWG’s Tap Water Database.
Who Is Affected?
Contamination was more likely to get worse in smaller communities between 2003 and 2017. Eighty-three percent of systems where contamination increased served 3,300 people or fewer. For our analysis, systems were put into the EPA-designated size categories based on how many water customers they serve.
Number and Percent of Systems With Increasing Nitrate Levels, by System Size, 2003 to 2017
| System size |
System count |
Percent of systems |
| Very small (<501) |
76 |
46% |
| Small (501-3,300) |
61 |
37% |
| Medium (3,301-10,000) |
18 |
11% |
| Large (10,001-100,000) |
10 |
6% |
| Very large (>100,000) |
0 |
0% |
Source: EWG, from Wisconsin Department of Natural Resources data.
Nitrate contamination was also more likely to get worse for people living in rural areas. In Wisconsin, 65 percent of communities with growing nitrate levels were rural, whereas 35 percent were urban, as defined by the U.S. Census Bureau.
Notes
1 Community water systems are public water supplies that serve residents in cities and towns year-round.