Minnesota Nitrate Trends: Methods and Detailed Results
WEDNESDAY, FEBRUARY 26, 2020
By Anne Weir Schechinger, Senior Analyst of Economics
In January, EWG revealed that half a million Minnesotans were drinking groundwater contaminated with elevated levels of nitrate.[1] These elevated levels were found in drinking water from both public water systems and private wells. Now new research from EWG shows that nitrate levels in public drinking water have been increasing over the past two and a half decades.
More than half of all public water systems in Minnesota that have elevated nitrate in drinking water saw contamination levels increase between 1995 and 2018. This increasing contamination does not just affect groundwater systems – both groundwater and surface water systems are experiencing worsening contamination. And although there isn’t enough data to evaluate whether nitrate levels are getting worse in private wells over time, it is likely that increasing nitrate levels in wells are similar to those in groundwater public water systems.
Nitrate is a chemical component of fertilizer and manure. It gets into groundwater and surface water sources of drinking water by running off farm fields and seeping into groundwater.
Drinking water with nitrate can have serious health consequences. Under the federal Clean Water Act, the legal limit for nitrate in drinking water is 10 milligrams per liter, or mg/L. This limit was set, in 1962, to guard against so-called blue baby syndrome, a potentially fatal condition that starves infants of oxygen if they ingest too much nitrate.[2] But newer research indicates that drinking water with 5 mg/L or even lower is associated with higher risks of colorectal cancer and adverse birth outcomes, such as neural tube birth defects.[3]
How We Conducted the Study
The data for nitrate testing of drinking water came from the Minnesota Department of Health.[4] Through public records requests, we received all finished water nitrate tests conducted at each public water system in the state between 1992 and 2018. Many of these test results can be found in EWG’s Tap Water Database.[5] We chose 1995 as the earliest date in our analysis, because the data we received became more consistent starting that year.
We analyzed the data for all public water systems that the U.S. Environmental Protection Agency considered “active” as of April 2019, and that conducted at least one test for nitrate (specifically contamination code 1040) between 1995 and 2018. The data set included systems that use groundwater as their main source of drinking water, as well as systems that use surface water.
Public water systems are either community or non-community systems, and we studied both types. Community water systems typically serve residents in cities and towns year-round – they are what most people think of as municipal systems or water utilities. There are far more non-community systems, which serve sites like churches and schools with their own source of drinking water, but those serve much smaller populations, usually for only part of the year.
We then narrowed the list of active public water systems that tested for nitrate to those with elevated nitrate. A system was considered to have elevated nitrate if it had at least one test at or above 3 mg/L at any time between 1995 and 2018. The level of 3 mg/L was chosen to represent elevated nitrate because the Minnesota Department of Health says a level of 3 mg/L indicates that “human-made sources of nitrate have contaminated the water and the level could increase over time.”[6]
For some of the analysis, we also looked at how many systems had at least one test at or above 5 or 10 mg/L, since 10 mg/L is the legal limit of nitrate in public drinking water, and 5 mg/L is associated with negative health outcomes.
Once we established the group of public water systems with elevated nitrate – those with at least one test at or above 3 mg/L – we analyzed whether their nitrate tests increased, decreased or stayed the same between 1995 and 2018. This was done by evaluating whether nitrate tests were correlated with year.
For each public water system, a correlation coefficient, or r value, was calculated to see whether nitrate positively or negatively correlated with year. Correlation coefficients describe the relationship between the two variables: Positive r values that are close to 1 show a strong relationship between year and increasing nitrate, and negative r values close to 1 show a strong relationship between year and decreasing nitrate.
Nitrate levels had increased in those public water systems that had a positive correlation, an r value above zero. Nitrate levels had decreased in systems with a negative correlation, an r value below zero. A few systems had zero correlation, which means their nitrate levels neither increased nor decreased over time.
After finding the correlation coefficients for every system with elevated nitrate, we calculated the t and p values for each system.[7] These indicators determine whether the increase or decrease in nitrate over time was statistically significant. If the correlations at each system were statistically significant, that meant the increase or decrease in nitrate was not just a random increase or decrease.[8] We evaluated statistical significance at a 95 percent confidence level (p<=0.05).
Besides studying whether each public water system’s nitrate levels increased or decreased between 1995 and 2018, we also looked at whether the overall annual nitrate average across all elevated systems went up over time. We did this by finding the nitrate average for all systems with elevated nitrate for every year from 1995 to 2018, and then the growth rate in nitrate averages from year to year. The average across all the years’ growth rates provided the annual average growth rate for all elevated systems, which was the average increase in the nitrate average in one year.
Finally, to evaluate who is most affected by elevated nitrate, we examined how many systems were located in an area with median household income below the state’s median household income. We used data from the 2017 American Community Survey, which is part of the U.S. Census.[9] We identified the 2013-2017 five-year median household income for every census block group in the state, and we assigned a median household income to each public water system based on which census block group the systems were located in. A system had a median income below the state’s income if its income was less than $65,559, the 2013-2017 median household income for the state of Minnesota.
Detailed Results
All Public Water Systems
Between 1995 and 2018, 6,660 public water systems that provided water for 4,954,473 people tested their finished drinking water for nitrate at least once. Of those, 14 percent had at least one test at or above 3 mg/L, 9 percent had at least one test at or above 5 mg/L, and 3 percent had at least one test at or above 10 mg/L (Table 1). The majority of systems got their water from groundwater sources: 99 percent of systems with elevated nitrate were on groundwater, whereas only 1 percent were on surface water.
Table 1. Public water system counts and populations with at least 1 test at or above 3, 5 or 10 mg/L.
| |
System count
|
Population served
|
Percent of active systems tested
|
|
With at least 1 Test >=3 mg/L
|
919
|
590,222
|
14%
|
|
With at least 1 test >=5 mg/L
|
569
|
378,239
|
9%
|
|
With at least 1 test >=10 mg/L
|
182
|
175,536
|
3%
|
For systems with at least one test at or above 3 mg/L, 51 percent had increasing nitrate levels over time, 48 percent had decreasing nitrate levels, and 1 percent stayed the same. Of the systems that were increasing, half were statistically significant, and half were not. However, of the 48 percent of systems that had nitrate levels going down over time, only 43 percent decreased significantly (Table 2).
Table 2. Increasing or decreasing public water systems with at least 1 test at or above 3 mg/L.
| |
System count
|
% of all systems
|
Statistically significant count
|
% of increasing/decreasing that are statistically significant
|
|
Systems with increasing nitrate
|
472
|
51%
|
235
|
50%
|
|
Systems with decreasing nitrate
|
439
|
48%
|
189
|
43%
|
For systems with at least one test at or above 5 mg/L, 47 percent had increasing nitrate levels over time, 52 percent had decreasing nitrate levels and 1 percent stayed the same. Of the systems that were increasing, half were statistically significant, and half were not. And of the 52 percent of systems that had nitrate levels going down over time, only 45 percent decreased significantly (Table 3).
Table 3. Increasing or decreasing public water systems with at least 1 test at or above 5 mg/L.
| |
System count
|
% of all systems
|
Statistically significant count
|
% of increasing/decreasing that are statistically significant
|
|
Systems with increasing nitrate
|
270
|
47%
|
134
|
50%
|
|
Systems with decreasing nitrate
|
294
|
52%
|
132
|
45%
|
For systems with at least one test at or above 10 mg/L, 40 percent had increasing nitrate levels over time and 60 percent had decreasing nitrate levels. Of the systems that were increasing, 51 percent were statistically significant. For the 60 percent of systems that had nitrate levels going down over time, half decreased significantly (Table 4).
Table 4. Increasing or decreasing public water systems with at least 1 test at or above 10 mg/L.
| |
System count
|
% of all systems
|
Statistically significant count
|
% of increasing/decreasing that are statistically significant
|
|
Systems with increasing nitrate
|
73
|
40%
|
37
|
51%
|
|
Systems with decreasing nitrate
|
109
|
60%
|
54
|
50%
|
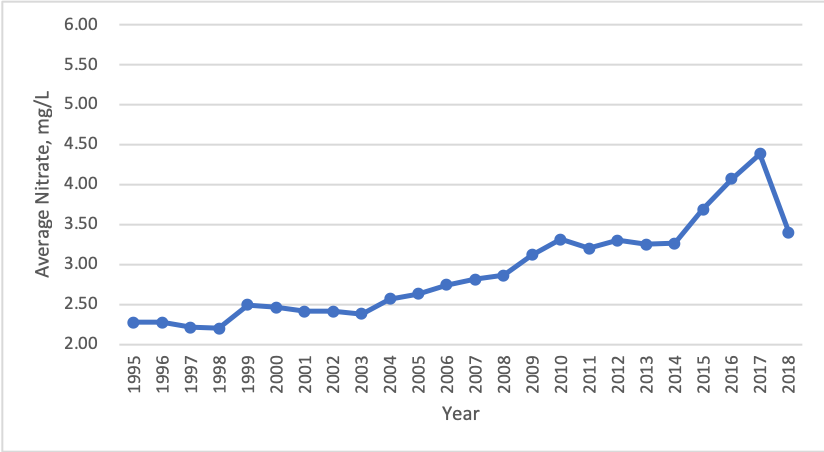
When we looked at annual averages between 1995 and 2018 across all elevated systems (with at least 1 test at or above 3 mg/L), we saw annual averages decreased by .57 percent per year. But for systems where nitrate increased over time, annual nitrate averages increased by 2.04 percent per year. And for the 235 systems that had a statistically significant increase, their average annual nitrate increased 2.97 percent per year. Figure 1 shows the annual nitrate averages for systems that had increasing nitrate over time.
Figure 1. Average annual nitrate for public water systems that had increasing nitrate between 1995 and 2018.
More than half of all systems with elevated nitrate had median household income below the state’s average. Specifically, 56 percent of systems with at least one test at or above 3 mg/L were in a census block group where income was below the state’s average.
Community Water Systems
Only 14 percent of all active public water systems were community water systems, but they accounted for 88 percent of the population. Almost 4,400,000 people were served by 901 active community water systems that tested for nitrate at least once between 1995 and 2018. Of those, 13 percent had at least one test at or above 3 mg/L, 8 percent had at least one test at or above 5 mg/L, and 3 percent had at least one test at or above 10 mg/L (Table 5). Most community water systems used groundwater: 97 percent of systems with elevated nitrate were on groundwater and 3 percent were on surface water.
Table 5. Community water system counts and populations with at least 1 test at or above 3, 5 or 10 mg/L.
| |
Community system count
|
Population Served
|
% of active community systems tested
|
|
With at least 1 test >=3 mg/L
|
115
|
504,669
|
13%
|
|
With at least 1 test >=5 mg/L
|
74
|
325,401
|
8%
|
|
With at least 1 test >=10 mg/L
|
24
|
160,011
|
3%
|
Community systems had a higher percent of systems with increasing nitrate over time than did non-community systems. For community systems with at least one test at or above 3 mg/L, 63 percent had increasing nitrate levels over time, 35 percent had decreasing nitrate levels, and 2 percent stayed the same. Of the systems that increased, 60 percent were statistically significant, and half of the systems that had decreasing nitrate levels were statistically significant (Table 6).
Table 6. Increasing or decreasing community water systems with at least 1 test at or above 3 mg/L.
| |
Community system count
|
% of community systems
|
Statistically significant count
|
% of increasing/decreasing that are statistically significant
|
|
Community systems with increasing nitrate
|
72
|
63%
|
43
|
60%
|
|
Community systems with decreasing nitrate
|
40
|
35%
|
20
|
50%
|
For community systems with at least one test at or above 5 mg/L, 54 percent had increasing nitrate levels over time, 42 percent had decreasing nitrate levels, and 4 percent stayed the same. Of the systems that were increasing, 65 percent were statistically significant, and 48 percent of the decreasing systems were statistically significant (Table 7).
Table 7. Increasing or decreasing community water systems with at least 1 test at or above 5 mg/L.
| |
Community system count
|
% of community systems
|
Statistically significant count
|
% of increasing/decreasing that are statistically significant
|
|
Community systems with increasing nitrate
|
40
|
54%
|
26
|
65%
|
|
Community systems with decreasing nitrate
|
31
|
42%
|
15
|
48%
|
For community systems with at least one test at or above 10 mg/L, 67 percent had increasing nitrate levels over time and 33 percent had decreasing nitrate levels. Most of the systems that increased – 69 percent – were statistically significant. For the 33 percent of systems whose nitrate levels decreased, half decreased significantly (Table 8).
Table 8. Increasing or decreasing community water systems with at least 1 test at or above 10 mg/L.
| |
Community system count
|
% of community systems
|
Statistically significant count
|
% of increasing/decreasing that are statistically significant
|
|
Community systems with increasing nitrate
|
16
|
67%
|
11
|
69%
|
|
Community systems with decreasing nitrate
|
8
|
33%
|
4
|
50%
|
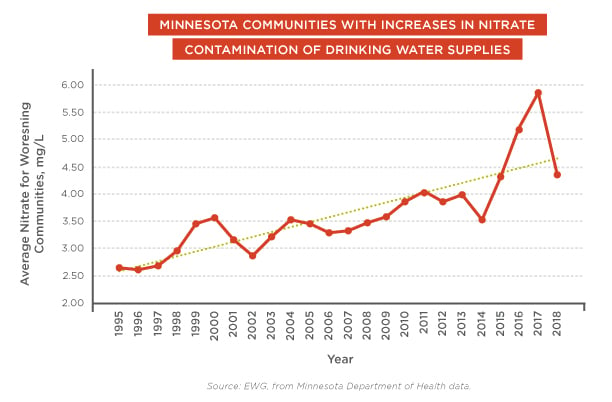
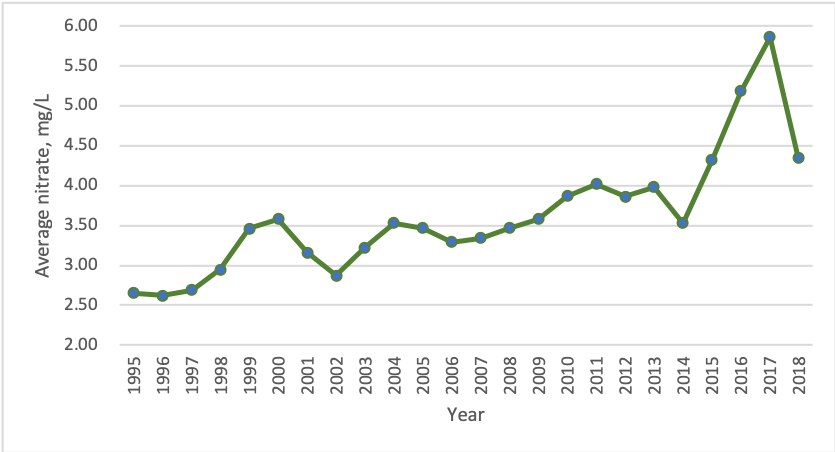
Community systems with elevated nitrate had higher annual nitrate averages between 1995 and 2018 than non-community systems. For the community systems where nitrate increased, the annual average nitrate in 1995 was 2.65 mg/L, which went up to 3.58 mg/L by 2009 and again up to 4.35 mg/L in 2018 (Figure 2).
Figure 2. Average annual nitrate for community water systems that had increasing nitrate between 1995 and 2018.
For all community systems with elevated nitrate, annual averages increased by 2.07 percent per year. Annual nitrate averages increased by 2.67 percent per year for community systems where nitrate increased, and for the community systems that had a statistically significant increase, their average annual nitrate increased 2.86 percent per year.
Community water systems were more likely than all public water systems to be in a Census block group with median household income below the state’s average. Across all community systems with elevated nitrate, 67 percent were in a Census block group with income below the state’s income. And when we looked just at community water systems with worsening nitrate contamination over time, 61 percent had income below the state’s average.
Non-Community Water Systems
Non-community water systems made up most of the active public systems that tested for nitrate at least once between 1995 and 2018. 86 percent, or 5,759 systems, were non-community systems, but they served a population of just 582,763. The number and percent of non-community systems with at least one test at or above 3, 5 or 10 mg/L were similar to those of community systems (Table 9). Almost all non-community systems with elevated nitrate were groundwater systems: 99 percent, or 799 systems.
Table 9. Non-community water system counts and populations with at least 1 test at or above 3, 5 or 10 mg/L.
| |
Non-community system count
|
Population Served
|
% of active non-community systems tested
|
|
With at least 1 test >=3 mg/L
|
804
|
85,553
|
14%
|
|
With at least 1 test >=5 mg/L
|
495
|
52,838
|
9%
|
|
With at least 1 test >=10 mg/L
|
158
|
15,525
|
3%
|
There were much smaller percentages of non-community systems than community systems that had increasing nitrate over time. For non-community systems with at least one test at or above 3 mg/L, half had increasing nitrate, and half had decreasing nitrate. For non-community systems with at least one test at or above 5 mg/L, 46 percent had increasing nitrate, and 53 percent had decreasing nitrate. And for non-community systems with at least one test at or above 10 mg/L, only 36 percent had increasing nitrate, and 64 percent had decreasing nitrate. Table 10 contains these numbers and the percent of the increasing and decreasing systems that were statistically significant.
Table 10. Increasing or decreasing non-community water systems with at least 1 test at or above 3, 5 or 10 mg/L.
| |
% of systems with increasing nitrate
|
% of systems with decreasing nitrate
|
% of increasing that are statistically significant
|
% of decreasing that are statistically significant
|
|
With at least 1 test >=3 mg/L
|
50%
|
50%
|
48%
|
42%
|
|
With at least 1 test >=5 mg/L
|
46%
|
53%
|
47%
|
44%
|
|
With at least 1 test >=10 mg/L
|
36%
|
64%
|
46%
|
50%
|
Average annual growth rates were not calculated for non-community systems, since nitrate levels were more likely to increase over time in community systems. We also did not find the percentage of non-community systems located in a census block group with median household income below the state’s income, because non-community systems do not serve residences. Sometimes people live near non-community systems, like churches or schools, but many also visit non-community systems, like restaurants or gas stations, but don’t live near them.