
To evaluate the nutritional content of foods in our database, EWG looked at 10 peer-reviewed nutrient profiling algorithms and tested five before choosing as best a model developed by Oxford University and the United Kingdom Food Standards Agency for the U.K.'s communications office, referred to here as Ofcom (Rayner 2009).
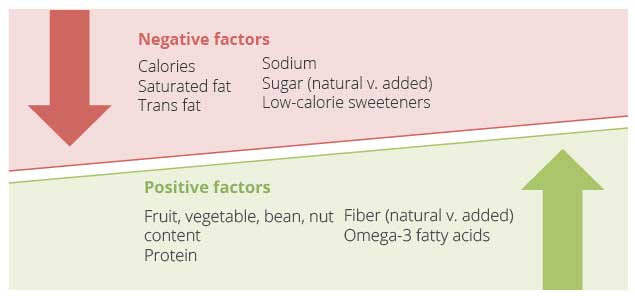
Ofcom uses six nutrients and the fruit, vegetable or nut content in 100 grams of a food to differentiate between more and less healthful foods. This generates a single score in which negative factors (calories, saturated fat, sugar and sodium content) are counterbalanced with points for positive factors (protein, fiber and minimally processed fruit, vegetable or nut content).
Each negative factor contributes 0-10 points, and each positive factor contributes 0-5 points. Total positive points are subtracted from the total negative points to generate a score that, counter-intuitively, ranges from minus 15 points for the most healthful foods to plus 40 points for the least healthful foods. (For more details, see Appendix.)
Ofcom has been used since 2007 in the U.K. to set a bar for limiting the advertising of unhealthful foods to children. International peer-reviewed research has affirmed its superiority:
Ofcom is the foundation of EWG's nutrition concern algorithm. Because it was not designed for the primary purpose of ranking the relative merit of foods, we further refined it in order to construct a continuum of healthful and unhealthful foods and account for additional components not included in Ofcom.
We made adjustments for:
Further refinements outside the Ofcom model included adjustments for liquids, large serving sizes that deviate too far from the 100-gram standard and tiny serving sizes.
Other calculations
We needed to develop a method to calculate fruit, vegetable, bean and nut content in food in the absence of the manufacturer's recipe. We also needed to translate the new raw scores to our nutrition concern score. These refinements and calculations are detailed below.
Summary table: EWG's raw scoring framework, per 100 grams of solid product*
| Points | Calories (kcals) | Sat. fat (g) | Trans fat (ingredient- based) | Sodium (mg) | Sugar (g) | Sugar multiplier (ingredient based) | Low-calorie sweeteners (ingredient- based) | Fruit, vegetable, bean, nut content (% by weight) | Protein (g) | Fiber (g) |
|---|---|---|---|---|---|---|---|---|---|---|
| 0 | ≤ 80 | ≤ 1 | No trans fat ingredients present and trans fat (g) = 0 | ≤ 90 | ≤ 4.5 | 1.00 natural sugars only 1.16 natural sugars appear before added sugars 1.33 added sugars appear before natural sugars 1.50 added sugars only |
No low-calorie sweetener ingredients present | ≤ 40 | ≤ 1.6 | ≤ 2.0 |
| 1 | > 80 | > 1 | -- | > 90 | > 4.5 | > 40 | > 1.6 | > 2.0 | ||
| 2 | > 160 | > 2 | > 180 | > 9.0 | > 60 | > 3.2 | > 3.0 | |||
| 3 | > 240 | > 3 | > 270 | > 13.5 | + 3.75 Low calorie sweetener ingredient present and sugars (g) > 0 | -- | > 4.8 | > 5.0 | ||
| 4 | > 320 | > 4 | Trans fat ingredients present and trans fat (g) = 0 | > 360 | > 18.0 | > 6.4 | > 6.0 | |||
| 5 | > 400 | > 5 | Trans fat (g) > 0 | > 450 | > 22.5 | > 80 | > 8.0 | > 8.0 | ||
| 6 | > 480 | > 6 | -- | > 540 | > 27.0 | -- | -- | |||
| 7 | > 560 | > 7 | > 630 | > 31.0 | + 7.50 Low-calorie sweetener ingredient present and sugars (g) = 0 | |||||
| 8 | > 640 | > 8 | > 720 | > 36.0 | ||||||
| 9 | > 720 | > 9 | > 810 | > 40.0 | ||||||
| 10 | > 800 | > 10 | > 900 | > 45.0 | ||||||
| 11 | -- | -- | -- | > 50.0 | ||||||
| 12 | > 55.0 | |||||||||
| 13 | > 60.0 | |||||||||
| 14 | > 65.0 | |||||||||
| 15 | > 70.0 | |||||||||
| 16 | > 75.0 | |||||||||
| 17 | > 80.0 |
Lighter colors indicate no changes from Ofcom, darker colors include EWG refinements
* when serving size ≤ 180 grams
Translation of raw EWG scores to nutrition concern score
We then converted our raw EWG scores to a 1 (best) to 10 (worst) nutrition concern score.
If a food contributes significantly more positive factors than negative ones - a raw score of less than -3 - the nutrition score is 1.
If the food contributes slightly more positive than negative factors or approaches a neutral point - a raw score between -3 and 0 - the following equation was used:
Nutrition Concern Score = 3 + (2/3 X raw EWG Score)
If a food contributes slightly more negative than positive factors - a raw score between 0 and 10 - the following equation was used:
Nutrition Concern Score = 3 + (0.106 X raw EWG Score)
If the food contributes significantly more negative than positive factors - a raw EWG score greater than 10 - the following equation was used:
Nutrition Concern Score = 2.26 + (0.18 x raw EWG Score)
Trans fat
Manmade trans fats are produced when vegetable oils are subject to high temperature or pressure to solidify the fat and increase shelf life, flavor stability and palatability (FDA 2013b). These modifications benefit the manufacturer but are detrimental to consumers' health. The U.S. Centers for Disease Control and Prevention estimates that eliminating man-made trans fats could prevent up to 20,000 heart attacks and 7,000 deaths a year (Dietz 2012). The U.S. Institute of Medicine recommends that consumption of trans fatty acids be as low as possible (IOM 2005a). In 2013, the FDA made a tentative determination that trans fats from partially hydrogenated oils (the primary dietary source) should no longer be classified as Generally Recognized As Safe (FDA 2013b).
Some trans fats occur naturally in meat and dairy products. These are of lower concern than man-made trans fats; some studies have found them to be beneficial, while others have found their effects to be neutral (Chardigny 2008; Mozaffarian 2009; Wang 2013).
| Examples of trans fat ingredients |
|---|
| Partially hydrogenated soy oil Partially hydrogenated cottonseed oil Vegetable shortening Partially hydrogenated vegetable oil Partially hydrogenated palm kernel oil Hydrogenated vegetable oil |
EWG added industrially produced or man-made trans fatty acids to the list of negative factors. Products containing quantifiable amounts of man-made trans fats listed on the Nutrition Facts label score five negative-factor points. Products containing ingredients known to be produced so as to contain significant quantities of trans fatty acids, such as partially hydrogenated oils, score four negative-factor points even if they do not contain enough per serving to require listing on the label (FDA 2013a).
| Trans fat points | Criteria |
|---|---|
| 0 | Contains no trans fat ingredients |
| 4 | Contains ingredients that are known to contain trans fats but not in quantities required to be reported on Nutrition Facts panel |
| 5 | Trans fat quantity disclosed on Nutrition Facts panel |
Added sugars
Too much of any sugar can lead to tooth decay. Added sugars, including granular sugars, glucose, molasses and high-fructose corn syrup, are of greater concern than natural sugars, such as raisins or fruit juice, because they promote obesity by adding calories and crowding out more nutrient-dense foods. Added sugar consumption has also been associated with diseases including heart disease and colon cancer (Yang 2014; Fung 2013). The average American consumes 22 teaspoons of sugar a day (NCI 2010; USDA and DHHS 2010), compared to the World Health Organization's recommendation of no more than 6-to-12 teaspoons a day (WHO 2002; WHO 2014).
Ofcom makes no distinction between natural and added sugars (Rayner 2009). Thus, a box of raisins with 24 grams of natural sugar will score the same 10 points as a chocolate pudding with 24 grams of added sugar. For EWG's purposes - to rate, rank and compare foods as accurately as possible - these distinctions matter, so we modified Ofcom to account for the differences between natural and added sugars.
| Examples of natural sugar ingredients | Examples of added sugar ingredients |
|---|---|
| Milk Tomato paste Apple juice concentrate Raisins Grape juice concentrate Dates |
Sugars Corn syrup Dextrose High fructose corn syrup Honey Molasses |
When only added sugar ingredients or only natural sugar ingredients are present, it is possible to calculate their exact contribution. But when both natural and added sugar ingredients are present, it is not possible to determine their relative contributions because the current Nutrition Facts label does not list added sugar content and EWG does not have access to manufacturers' exact recipes.
However, the FDA requires manufacturers to list the ingredients in descending order by weight (FDA 2013a). EWG uses the order of natural and added sugar ingredients on the list as a proxy for their relative contributions.
For products with no added sugars, the original Ofcom framework is used. There is no EWG multiplier for products containing only natural sugars. For products where a natural sugar ingredient is listed before the added sugar ingredient, a multiplier of 1.166 is used. Where the added sugar ingredient is listed before the natural sugar ingredient, a multiplier of 1.33 is used. If a product contains added sugars only, a multiplier of 1.50 is used.
The original Ofcom framework caps the sugar points at 10, effectively scoring a product that is 45 percent sugar by weight the same as a product that is 80 percent sugar by weight. That is, a 30-gram candy bar with 15 grams of sugar scores the same as one with 21 grams of sugar, even though one contains two more teaspoons of sugar per serving. Given the extensive research on the negative health effects of excessive sugar consumption (de Koning 2012; Malik 2010; Marriott 2010; Moynihan 2014; Welsh 2011; WHO 2002; Yang 2014), these distinctions are important to capture, so EWG expanded the sugar points, capping them instead at 17 points, or 80 percent sugar by weight.
| Sugar content per 100 grams | Natural sugars only (Original Ofcom points) | Natural sugars listed before added sugars | Added sugars listed before natural sugars | Added sugars only |
|---|---|---|---|---|
| ≤ 4.5 g | 0 | 0.0 | 1.33 | 1.5 |
| > 4.5 g | 1 | 1.166 | 1.33 | 1.5 |
| > 9 g | 2 | 2.332 | 2.66 | 3.0 |
| > 13.5 g | 3 | 3.498 | 3.99 | 4.5 |
| > 18 g | 4 | 4.664 | 5.32 | 6.0 |
| > 22.5 g | 5 | 5.830 | 6.65 | 7.5 |
| > 27 g | 6 | 6.996 | 7.98 | 9.0 |
| > 31 g | 7 | 8.162 | 9.31 | 10.5 |
| > 36 g | 8 | 9.328 | 10.64 | 12.0 |
| > 40 g | 9 | 10.494 | 11.97 | 13.5 |
| > 45 g | 10 | 11.660 | 13.3 | 15.0 |
| > 50 g | 11 | 12.826 | 14.63 | 16.5 |
| > 55 g | 12 | 13.992 | 15.96 | 18.0 |
| > 60 g | 13 | 15.158 | 17.29 | 19.5 |
| > 65 g | 14 | 16.324 | 18.62 | 21.0 |
| > 70 g | 15 | 17.490 | 19.95 | 22.5 |
| > 75 g | 16 | 18.656 | 21.28 | 24.0 |
| > 80 g | 17 | 19.822 | 22.61 | 25.5 |
Low-calorie sweeteners
Low-calorie sweeteners may condition people to crave overly sweet foods (Mattes 2009), discouraging or displacing the consumption of more nutritious foods such as vegetables, fruits, beans, nuts or whole grains (IOM 2007). The Institute of Medicine recommends that schools not serve children diet foods or beverages. (IOM 2007).
In addition, there is insufficient evidence that low-calorie sweeteners significantly reduce overall calorie intake, contribute to weight loss or improve health (Gardner 2014; Shankar 2013). Some studies have found that the addition of sweetness or other palatable stimulus without calories may actually increase appetite (Mattes 2009; Sørensen 2003). A recent study raised concerns that low-calorie sweeteners could cause glucose intolerance, a precursor to diabetes (Suez 2014).
For now, EWG concludes that people should limit their consumption of both sugar and low-calorie sweeteners, advice echoed by other nutrition experts (Swithers 2013; Shankar 2013).
| Examples of low-calorie sweetener ingredients |
|---|
| Sucralose Acesulphame potassium Aspartame Sorbitol Maltitol Stevia extract |
Reflecting the IOM's concern that diet foods and beverages can displace water and more nutrient-dense foods (IOM 2007), EWG added the presence of low-calorie sweeteners to the list of negative factors considered. When a product contains a low-calorie sweetener in the absence of calories, 7.5 negative-factor points are scored. When a product contains low calorie sweeteners yet still provides calories, 3.75 negative-factor points are scored.
| Low-calorie sweetener points | Criteria |
|---|---|
| 0 | Contains no low-calorie sweetener ingredients |
| 3.75 | Contains low-calorie sweetener ingredient and sugars (grams greater than 0) |
| 7.5 | Contains low-calorie sweetener ingredient and sugars (grams = 0) |
Added fibers
Many studies confirm the benefits of a high-fiber diet rich in fruit, vegetables, beans and whole grains. But not all fibers are created equal. For example, some fibers lower the incidence of cancer or heart disease, improve laxation or help steady blood sugar levels; others don't.
On average, Americans consume only half as much fiber - 15 grams - as they need each day (USDA and DHHS 2010). While adding fibers to processed foods can help address the lack of fiber, it can also encourage consumption of processed foods over naturally fiber- and nutrient-rich fruit, vegetables, beans and whole grains.
Added fibers may be extracted from industrial byproducts such as wood pulp or plant starches, made into a powder and added into highly processed foods to increase fiber content and make them appear more healthful. There is much less data on the health effects of these added fibers and whether their effects are preserved once the fibers have been isolated from their plant source and added to food products (IOM 2001; Jones 2012; Turner and Lupton 2011).
Therefore, EWG lowered the positive-factor points awarded to products with added fiber ingredients. EWG used the Institute of Medicine's definition of fiber to distinguish "dietary" fibers where the "plant matrix is largely intact" from "isolated" fibers that are "synthetically manufactured" or "isolated or extracted using chemical, enzymatic, or aqueous steps." (IOM 2001)
Products that contain isolated fiber ingredients, such as polydextrose, have two points subtracted from the points awarded based on fiber content alone. For example, a sugary granola bar with isolated fibers containing nine grams of fiber per 100 grams of food would be awarded three fiber points instead of five.
Some fibers such as wheat bran are added to increase the fiber content of the final product but still maintain their structure and meet the IOM's definition of dietary fiber (IOM 2001). Still, EWG reduced the positive-factor fiber points for these added dietary fibers by one point to distinguish products containing them from those containing only intact whole grains and other naturally fiber-rich foods.
EWG also considers Ofcom's original fiber credit too generous and not necessarily representative of the range of fiber values found in 100 grams of food. EWG's criteria reflect the range of values found in 100 grams of foods that are naturally high in fiber, such as whole grains. Here is a comparison of Ofcom and EWG's criteria:
| Fiber points | Ofcom's criteria | EWG's criteria |
|---|---|---|
| 0 | ≤0.9 g | <2 g |
| 1 | 0.9 - 1.9 g | 2.0 - 2.9 g |
| 2 | 1.9 - 2.8 g | 3.0 - 4.9 g |
| 3 | 2.8 - 3.7 g | 5.0 - 5.9 g |
| 4 | 3.7 - 4.7 g | 6.0 - 7.9 g |
| 5 | >4.7 g | >8.0 g |
Omega-3 fatty acids
EWG added omega-3 fatty acids to the positive factors considered. Nutrition scores were boosted for seafood products that contribute significant amounts of omega-3 fatty acids.
Seafood species are deemed to have moderate omega-3 levels if a four-ounce serving contains 400 milligrams of the omega-3 fats known as EPA and DHA, as determined by the USDA Nutrient Database (USDA 2013). This amount would contribute one-fourth to one-half of the weekly recommended intake for a pregnant woman or adult at average or high risk for cardiac disease, as determined by the 2010 Dietary Guidelines for Americans (USDA and DHHS 2010). Products that contain moderate omega-3 level seafood ingredients drop one point (improving the score) from the final, scaled nutrition concern score.
Seafood items with greater than 850 milligrams of omega-3 fats per four-ounce serving are deemed to have high levels and provide more than half of the weekly recommendation. Products that contain high omega-3 level seafood ingredients drop two points (improving the score) from the final, scaled nutrition concern score.
EPA and DHA-enhanced eggs, grass-fed dairy and meat do not contain omega-3 fatty acids in clinically significant quantities sufficient to warrant the same boost given to fish. You would need to eat two or more EPA- and DHA-enhanced eggs a day in order to achieve the same amount of heart-healthy omega-3 fatty acids as are present in a moderate omega-3 level fish.
Liquids
The 100-gram serving standard used by Ofcom has been criticized for being too "lenient toward caloric beverages unless special provisions are made." (Drewnowski 2009) And it's true that if beverages and solid foods are compared on the same scale, 100 grams of a typical beverage will score better than solid food, because of the beverage's high water content.
Foods and beverages are consumed in very different amounts (Drewnowski 2009). Ofcom evaluates solid foods for a 100-gram serving. An equivalent serving for a beverage is eight fluid ounces, approximately 240 grams.
Ofcom addressed this by setting a different final cut point for what it defined as a "less healthy" beverage. EWG chose to use a different set of liquid cut points by taking the original framework and dividing it by 2.4 - in effect, comparing beverages at 240 ml, or approximately one cup. This approach addresses the concerns voiced in the peer-reviewed literature and echoes the approaches used by other researchers in the field of nutrient profiling (Darmon 2009).
Summary table of EWG's raw scoring framework, per 100 grams of liquid product*
| Points | Calories (kcals) | Sat. fat (g) | Trans fat (ingredient-based) | Sodium (mg) | Sugar (g) | Sugar multiplier (ingredient-based) | Low-calorie sweeteners (ingredient- based) | Fruit, vegetable, bean, nut content (% by weight) | Protein (g) | Fiber (g) |
|---|---|---|---|---|---|---|---|---|---|---|
| 0 | ≤ 33.3 | ≤ 0.42 | No trans fat ingredients present and trans fat (g) = 0 | ≤ 37.5 | ≤ 1.875 | 1.00 natural sugars only 1.16 natural sugars listed before added sugars 1.33 added sugars listed before natural sugars 1.50 added sugars only |
No low-calorie sweetener ingredients | ≤ 40 | ≤ 0.6 | ≤ 0.833 |
| 1 | > 33.3 | > 0.42 | -- | > 37.5 | > 1.875 | > 40 | > 0.66 | > 0.833 | ||
| 2 | > 66.6 | > 0.83 | > 75.0 | > 3.750 | > 60 | > 1.33 | > 1.25 | |||
| 3 | > 100.0 | > 1.25 | > 112.5 | >5.625 | + 3.75 Low-calorie sweetener ingredient present and sugars (g) > 0 | -- | > 2.00 | > 2.083 | ||
| 4 | > 133.3 | > 1.67 | Trans fat ingredients present and trans fat (g) = 0 | > 150.0 | > 7.500 | > 2.66 | > 2.5 | |||
| 5 | > 166.6 | > 2.08 | Trans fat (g) > 0 | > 187.5 | > 9.400 | > 80 | > 3.33 | > 3.33 | ||
| 6 | > 200.0 | > 2.50 | -- | > 225.0 | > 11.250 | -- | -- | |||
| 7 | > 233.3 | > 2.90 | > 262.5 | > 12.916 | + 7.50 Low-calorie sweetener ingredient present and sugars (g) = 0 | |||||
| 8 | > 266.6 | > 3.30 | > 300.0 | > 15.000 | ||||||
| 9 | > 300.0 | > 3.75 | > 337.5 | > 16.666 | ||||||
| 10 | > 333.3 | 4.17 | > 375.0 | > 18.750 | ||||||
| 11 | -- | -- | > 20.833 | |||||||
| 12 | > 22.916 | |||||||||
| 13 | > 24.000 | |||||||||
| 14 | > 27.083 | |||||||||
| 15 | > 29.167 | |||||||||
| 16 | > 31.250 | |||||||||
| 17 | > 33.333 |
Lighter colors indicate no changes from Ofcom, darker colors include EWG refinements
* when serving size ≤ 180 grams
We applied these liquid cut points to all beverages or foods that were more than 60 percent water: beverages, milk, shakes, kefir, yogurt, puddings, ice cream, popsicles and other frozen desserts.
Large serving sizes that deviate from the 100-gram standard
Whether an algorithm relies on a 100-calorie, 100-gram or serving-size standard to score foods, there are pitfalls. The 100-calorie standard cannot accurately score foods with no or very low calories. A serving-size standard may score identical foods with different portion sizes differently. A 100-gram standard scores foods with very small portions harshly and those with very large portions and high water content favorably (Drewnowski 2009).
To account for issues in the 100-gram standard, EWG applied a serving-size layer. The more a product's serving size deviates from the 100-gram standard, the more weight EWG places on evaluating it by serving size.
EWG's serving-size scale uses cut points per serving instead of per 100 grams. Ofcom's cut points were based on the percent of the nutrient's U.K. Guideline Daily Amount provided by 100 grams, capped at a maximum of 37.5 percent for negative factors and 18.75 percent for positive factors. EWG's cut points are based on the percent of the nutrient's FDA-assigned Daily Value, except where noted below in the table below. A Daily Value is usually similar to the nutrient's Recommended Dietary Allowance or Adequate Intake.
Summary table of EWG's percent Daily Value score
| Factor | Denominator Percent Daily Value | Rationale | Reference |
|---|---|---|---|
| Saturated Fat | 7.5 g | 37.5% of FDA's Daily Value for saturated fat | FDA 2007 |
| Sugar | 18.75 g | 37.5% of WHO's recommended daily limit of added sugar | WHO 2002 |
| Sodium | 562.5 mg | 37.5% of IOM's Adequate Intake for sodium | IOM 2005b |
| Fiber | 9.375 g | 37.5% of FDA's Daily Value for fiber | FDA 2007 |
| Protein | 18.75 g | 37.5% of FDA's Daily Value for protein | FDA 2007 |
For products above 180 grams, the closer the serving size comes to 340 grams, the more weight is given to the percent Daily Value score, so that a 240-gram product is scored 63 percent by its percent Daily Value score and 37.5 percent by its per 100-gram Ofcom score.
EWG does not apply the serving-size layer to calories, as that would change the main purpose of that metric, to measure the calorie density of the product. It was not necessary to create a percent Daily Value score for the other factors in our framework as they were not based on a 100-gram standard to begin with.
Tiny serving sizes
Manufacturers often use small serving sizes that reflect "ideal" usage. Some serving sizes are so small (less than thirty grams) that the nutritional information often gets rounded down to zero, making it impossible to accurately score the product. This is often misleading and can lead one to think that the product has no calories, sugar, sodium or other nutrients. For products with serving sizes of less than thirty grams and less than fifteen calories, EWG increased the score slightly, as we believe the nutrition information is misleading and want to encourage manufacturers to disclose the nutritional contents of the product based on typical rather than "ideal" use.
Calculating fruit, vegetable and nut content
When the Ofcom algorithm is used by the U.K. government, manufacturers provide the weight of each ingredient in a product, which enables an exact calculation of the fruit, vegetable and nut content in a food. Because EWG typically did not have access to such detailed information, we developed a separate algorithm that uses the nutrient content of the fruit, vegetable or nut (FVN) and the order of the ingredient's listing as a proxy for the percentage of fruit, vegetable or nut in the product.
1) When FVN ingredient is in the first position: a) If nutrient [max of (sugar, fat or carb)] (g)/total product (g) > FVN nutrient_content (%), then
Calculated percent FVN = ((total product (g) - nutrient [max of (sugar, fat, carb)] (g))/ (1 - FVN nutrient_content (%))) /total product (g) *100
b) If nutrient [max of (sugar, fat, carb)] (g)/total product (g) < FVN nutrient_content (%), then Calculated percent FVN = (nutrient [max of (sugar, fat, carb)] (g)/total product (g) )/ FVN Nutrient content (%) *100
We also pegged the results of this calculation to our degree-of-processing score and reduced the calculated percent of FVN along a linear scale depending on the extent of processing of the product.
2) When FVN ingredients are NOT in the 1st position: The percent FVN range is the max of:
0% to (100%/(n)) * (total number of FVN ingredients before n) n = position of each FVN ingredient
a) example: FVN at positions (2,4,5,9,10)
2: 100%/2 = 50% * 1 = 50%
4: 100%/4 = 25% *2 = 50%
5: 100%/5 =20% *3 = 60%
9: 100%/9 = 11% * 4 = 44%
10: 100%/10 = 10% * 5 = 50%
FVN (2,4,5,9,10) = 0% to 60%. FVN points = 1
Since the percentage of each ingredient in a product is unknown, we can't say where the product falls in the calculated range, so we chose to give each product the benefit of the doubt and score products based on the maximum percentage.
FVN (2,3) = 0 to 66%. FVN points = 2
Ofcom scoring framework
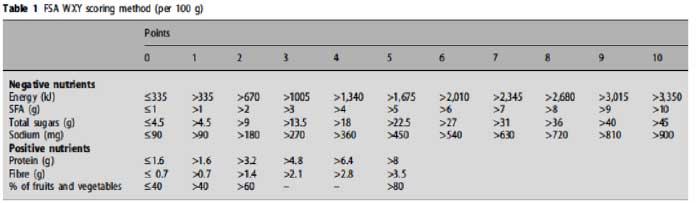
Source: Quinio 2007
Background on the development of Ofcom's model
The U.K.'s Office of Communication asked the Food Standards Agency - similar to the FDA - to develop a nutrient profiling model to provide the scientific basis for regulating the promotion of less healthy foods to children under 16.
Researchers at Oxford University were commissioned to develop the model. An expert group of nutrition scientists, dietitians, food industry representatives, consumer advocates and policy makers oversaw and guided their work.
In 2004, the researchers conducted an extensive literature review of existing nutrient profiling systems. That research informed their development, initial testing and refinement of their own model.
They conducted trials of 28 different approaches using different nutrients, bases (100 calories, 100 grams or per serving), models (threshold or scoring), and nutrient cut points to categorize foods as healthy and unhealthy. For eight of the most promising models, they tested the accuracy, sensitivity and specificity of the different models by comparing the results generated against more than 200 indicator foods. Of these, the three top-performing models were selected by the expert group for further refinement (Rayner 2004).
In response to recommendations from the expert group, six variations were developed for the first model (which included only negative factors), three for the second (including both positive and negative factors) and three for the third model (a scoring system model). The 12 models were tested again for accuracy, sensitivity and specificity, as well as for score distribution and concurrence with dietary advice. The top-performing model was selected for further consideration.
The model then underwent five months of external scrutiny and assessment. Eighty stakeholders, including food manufacturers, public health agencies and consumer advocates, submitted responses. A scientific workshop was also held. The expert group considered 21 possible refinements suggested by stakeholders. After review, the expert group recommended five for further investigation.
In 2005, 12 additional modifications to the model were developed and tested by Oxford researchers. Five were further tested, and after another public consultation a new model, the one EWG is using, was selected as the final model (Rayner 2005). It has been in regulatory effect since 2007.
Arambepola C, Scarborough P, Rayner M. 2008. Validating a nutrient profile model. Public Health Nutr. 11(4): 371-8
Azaïs-Braesco V, Goffi C, Labouze E. 2006. Nutrient profiling: comparison and critical analysis of existing systems. Public Health Nutr. 9(5): 613-22
Bellisle F, Drewnowski A. 2007. Intense sweeteners, energy intake and the control of body weight. Eur J Clin Nutr. 61(6): 691-700
Chardigny JM, Destaillats F, Malpuech-Brugère C, Moulin J, Bauman DE, Lock AL, Barbano DM, Mensink RP, Bezelgues JB, Chaumont P, Combe N, Cristiani I, Joffre F, German JB, Dionisi F, Boirie Y, Sébédio JL. 2008. Do trans fatty acids from industrially produced sources and from natural sources have the same effect on cardiovascular disease risk factors in healthy subjects? Results of the trans Fatty Acids Collaboration (TRANSFACT) study. Am J Clin Nutr. 87(3): 558-66
Chowdhury R, Warnakula S, Kunutsor S, Crowe F, Ward HA, Johnson L, Franco OH, Butterworth AS, Forouhi NG, Thompson SG, Khaw KT, Mozaffarian D, Danesh J, Di Angelantonio E. 2014. Association of dietary, circulating, and supplement fatty acids with coronary risk: a systematic review and meta-analysis. Ann Intern Med. 160(6): 398-406
Darmon N, Vieux F, Maillot M, Volatier JL, Martin A. 2009. Nutrient profiles discriminate between foods according to their contribution to nutritionally adequate diets: a validation study using linear programming and the SAIN,LIM system. Am J Clin Nutr. 89(4): 1227-36
de Koning L, Malik VS, Kellogg MD, Rimm EB, Willett WC, Hu FB. 2012. Sweetened beverage consumption, incident coronary heart disease, and biomarkers of risk in men. Circulation. 125(14): 1735-1741
Dietz WH, Scanlon KS. 2012. Eliminating the use of partially hydrogenated oil in food production and preparation. JAMA. 308(2): 143-4
Drewnowski A. 2009. Defining nutrient density: development and validation of the nutrient rich foods index. J Am Coll Nutr. 28(4): 421S-426S
EWG (Environmental Working Group). 2011. Meat Eater's Guide to Climate Change + Health. Available: http://www.ewg.org/meateatersguide/ [Accessed Sept. 12, 2014]
EWG (Environmental Working Group). 2012. Good Food on a Tight Budget. Available: http://www.ewg.org/release/good-food-tight-budget-ewg-s-new-easy-useguide [Accessed March 20, 2014]
FDA (Food and Drug Administration). 2007. Food Labeling: Revision of Reference Values and Mandatory Nutrients. Fed. Reg. Vol 72, No. 212: 62149 - 62175, November 2, 2007. Available: http://www.fda.gov/OHRMS/DOCKETS/98fr/07-5440.pdf [Accessed Sept. 12, 2014]
FDA (Food and Drug Administration). 2013a. Guidance for Industry: A Food Labeling Guide. Available: http://www.fda.gov/FoodLabelingGuide [Accessed June 4, 2014]
FDA (Food and Drug Administration). 2013b. Tentative Determination Regarding Partially Hydrogenated Oils; Request for Comments and for Scientific Data and Information. Fed. Reg. Vol 78, No. 217: 67169 - 67175, November 8, 2013. Available: https://federalregister.gov/a/2013-26854 [Accessed Sept. 12, 2014]
Fung TT, Brown LS. 2013. Dietary Patterns and the Risk of Colorectal Cancer. Curr Nutr Rep. 2(1): 48-55
Gardner C. 2014. Non-nutritive sweeteners: evidence for benefit vs. risk. Curr Opin Lipidol. 25(1): 80-4
Garsetti M, de Vries J, Smith M, Amosse A, Rolf-Pedersen N. 2007. Nutrient profiling schemes: overview and comparative analysis. Eur J Nutr. 46 Suppl 2: 15-28
Hooper L, Summerbell CD, Thompson R, Sills D, Roberts FG, Moore HJ, Davey Smith G. 2012. Reduced or modified dietary fat for preventing cardiovascular disease. Cochrane Database Syst Rev. 5: CD002137
IOM (Institute of Medicine). 2001. Dietary Reference Intakes: Proposed Definition of Dietary Fiber. Available: http://www.nap.edu/openbook.php?record_id=10161 [Accessed June 4, 2014]
IOM (Institute of Medicine). 2005a. National Research Council. Dietary Reference Intakes for Energy, Carbohydrate, Fiber, Fat, Fatty Acids, Cholesterol, Protein, and Amino Acids (Macronutrients). Available: [Accessed June 4, 2014]
IOM (Institute of Medicine). 2005b. National Research Council. Dietary Reference Intakes for Water, Potassium, Sodium, Chloride, and Sulfate. Available: http://www.nap.edu/openbook.php?record_id=10925 [Accessed June 4, 2014]
IOM (Institute of Medicine). 2007. National Research Council. Nutrition Standards for Foods in Schools: Leading the Way Toward Healthier Youth. Available: http://www.nap.edu/openbook.php?record_id=11899 [Accessed Oct. 13, 2014]
IOM (Institute of Medicine). 2010. Strategies to Reduce Sodium Intake in the United States. Available: http://www.nap.edu/openbook.php?record_id=12818 [Accessed June 18, 2014]
Jones JM, Klurfeld DM, Slavin J, Waybright S. 2012. Preparing for the 2015 Dietary Guidelines: Attributes of Refined Grains, Added Fibers, and Bran. Cereal Foods World. 57(2): 86-87
Lobstein T, Davies S. 2009. Defining and labeling 'healthy' and 'unhealthy' food. Public Health Nutr. 12(3): 331-40
Malik VS, Popkin BM, Bray GA, Després JP, Hu FB. 2010. Sugar-sweetened beverages, obesity, type 2 diabetes mellitus, and cardiovascular disease risk. Circulation. 121(11): 1356-1364
Marriott BP, Olsho L, Hadden L, Connor P. 2010. Intake of added sugars and selected nutrients in the United States, National Health and Nutrition Examination Survey (NHANES) 2003-2006. Crit Rev Food Sci Nutr. 50(3): 228-58
Mattes RD, Popkin BM. 2009. Nonnutritive sweetener consumption in humans: effects on appetite and food intake and their putative mechanisms. Am J Clin Nutr. 89(1): 1-14.
Moynihan PJ, Kelly SA. 2014. Effect on caries of restricting sugars intake: systematic review to inform WHO guidelines. J Dent Res. 93(1): 8-18
Mozaffarian D, Aro A, Willett WC. 2009. Health effects of trans-fatty acids: experimental and observational evidence. Eur J Clin Nutr. 63 Suppl 2: S5-21
NCI (National Cancer Institute). 2010. Usual intake of added sugars. In: Usual Dietary Intakes: Food Intakes, US Population 2001-04. November 2008. Available: http://riskfactor.cancer.gov/diet/usualintakes/addedsugars.html [Accessed June 4, 2014]
Quinio C, Biltoft-Jensen A, De Henauw S, Gibney MJ, Huybrechts I, McCarthy SN, O'Neill JL, Tetens I, Turrini A, Volatier JL. 2007. Comparison of different nutrient profiling schemes to a new reference method using dietary surveys. Eur J Nutr. 46 Suppl 2: 37-46
Rayner M, Scarborough P, Stockley L. 2004. Nutrient Profiles: Options for definitions for use in relation to food promotion and children's diets. Available: http://www.food.gov.uk/multimedia/pdfs/nutrientprofilingfullreport.pdf [Accessed Nov. 9, 2012].
Rayner M, Scarborough P, Stockley L, Boxer A. 2005. Nutrient Profiles: Further refinement and testing of Model SSCg3d. Available: http://www.food.gov.uk/multimedia/pdfs/npreportsept05.pdf [Accessed Nov. 9, 2012]
Rayner M, Scarborough P, Lobstein T. 2009. The UK Ofcom Nutrient Profiling Model: Defining ‘healthy' and ‘unhealthy' foods and drinks for TV advertising to children. Available: http://www.publichealth.ox.ac.uk/bhfhprg/publicationsandreports/acad-publications/bhfcpnppublished/nutrientprofilemodel [Accessed Nov. 9, 2012]
Rolls BJ, Drewnowski A, Ledikwe JH. 2005. Changing the energy density of the diet as a strategy for weight management. J Am Diet Assoc. 105(5 Suppl 1): S98-103.
Scarborough P, Boxer A, Rayner M, Stockley L. 2007. Testing nutrient profile models using data from a survey of nutrition professionals. Public Health Nutrition. 10: 337-45
Scarborough P, Boxer A, Rayner M, Stockley L. 2007. Testing nutrient profile models using data from a survey of nutrition professionals. Public Health Nutr. 10(4): 337-45.
Schwingshackl L, Hoffmann G. 2014. Dietary fatty acids in the secondary prevention of coronary heart disease: a systematic review, meta-analysis and meta-regression. BMJ Open. 4(4): e004487
Shankar P, Ahuja S, Sriram K. 2013. Non-nutritive sweeteners: review and update. Nutrition. 29(11-12): 1293-9
Sø rensen LB, Møller P, Flint A, Martens M, Raben A. 2003. Effect of sensory perception of foods on appetite and food intake: a review of studies on humans. Int J Obes Relat Metab Disord. 27(10): 1152-66
Suez J, Korem T, Zeevi D, Zilberman-Schapira G, Thaiss CA, Maza O, Israeli D, Zmora N, Gilad S, Weinberger A, Kuperman Y, Harmelin A, Kolodkin-Gal I, Shapiro H, Halpern Z, Segal E, Elinav E. 2014. Artificial sweeteners induce glucose intolerance by altering the gut microbiota. Nature. doi: 10.1038/nature13793. [Epub ahead of print]
Turner ND, Lupton JR. 2011. Dietary fiber. Adv Nutr. 2(2): 151-2
USDA (U.S. Department of Agriculture). 2009. CNPP Food Prices Database, 2003-04. Available: http://www.cnpp.usda.gov/USDAFoodPlansCostof- Food.htm [Accessed June 18, 2014]
USDA (U.S. Department of Agriculture). 2013. USDA National Nutrient Database for Standard Reference, Release 26. Agricultural Research Service Nutrient Data Laboratory. Available: http://www.ars.usda.gov/ba/bhnrc/ndl [Accessed Dec. 11, 2013]
USDA and DHHS (U.S. Department of Agriculture and Department of Health and Human Services). 2010. Dietary Guidelines for Americans, 2010. Available: http://www.cnpp.usda.gov/dietaryguidelines.htm [Accessed Oct. 13, 2014]
Wang Y, Proctor SD. 2013. Current issues surrounding the definition of trans-fatty acids: implications for health, industry and food labels. Br J Nutr. 110(8): 1369-83
Welsh JA, Sharma A, Cunningham SA, Vos MB. 2011. Consumption of added sugars and indicators of cardiovascular disease risk among US adolescents. Circulation. 123(3): 249-57
WHO (World Health Organization). 2002. Diet, nutrition and the prevention of chronic diseases: Report of a Joint WHO/FAO Expert Consultation. WHO Technical Report Series, No. 916. Available: http://whqlibdoc.who.int/trs/WHO_TRS_916.pdf [Accessed March 30, 2014]
WHO (World Health Organization). 2014. Draft guidelines on free sugars released for public consultation, 5 March 2014. Sugars intake for adults and children. Available: http://www.who.int/mediacentre/news/notes/2014/consultation-sugar-guidel... [Accessed March 21, 2014]
Yang Q, Zhang Z, Gregg EW, Flanders WD, Merritt R, Hu FB. 2014. Added sugar intake and cardiovascular diseases mortality among US adults. JAMA Intern Med. 174(4): 516-24

The Eat Well Guide helps consumers find locally grown and sustainably produced food. Listings include farms, restaurants, stores, farmers' markets, and CSAs throughout the United States.
Visit the Eat Well GuideSign up to receive email updates, action alerts, healthy eating tips, promotions to support our work and more from EWG! You can opt out at any time.


 EWG's Good Food on a Tight Budget
 EWG's Shopper's Guide to Pesticides in Produce
 EWG's Good Seafood Guide
 EWG's Healthy Living: Home Guide
 EWG's Tap Water Database
 EWG and Keep A Breast Foundation's Dirty Dozen List of Endocrine Disruptors