
EWG has been working for five years to protect American children from the excessive amounts of sugar in cereals. Through our campaign and the work of other public interest groups, we're pushing regulators and the food industry toward healthier products and greater transparency.
In 2010, scientists at the National Cancer Institute reported that breakfast cereals were one of the major sources of added sugar in the diets of children under 8, ranking fifth after sugar bombs like sugary drinks, cookies, candy and ice cream. Soon after, in 2011, EWG called cereal makers to task for packing more sugar into kids' breakfasts than cookies or Twinkies.
EWG has been working to increase transparency for consumers with our Food Scores database, a freely resource that unmasks more than 80,000 food items. Food Scores allows shoppers to identify better food options, avoiding ones with poor nutritional quality, ingredients of concern and products that have been overly processed.
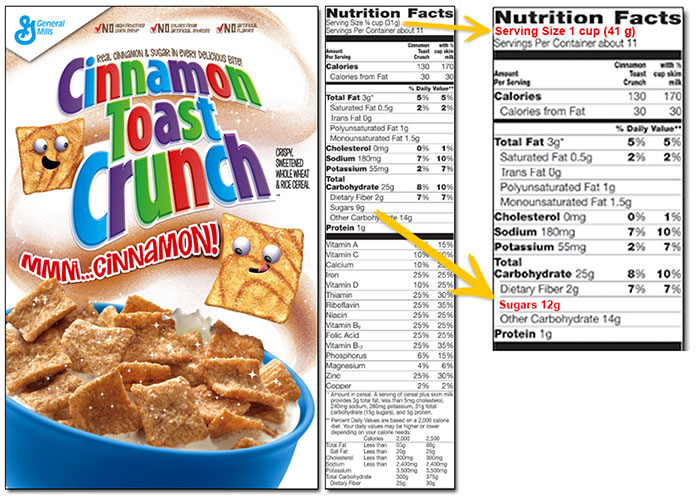
The U.S. Food and Drug Administration requires that the Nutrition Facts labels on cereal boxes disclose how much sugar is in each serving––important information that helps parents make healthier choices for their kids. But the labels are misleading: the sugar content is based on an outdated and unrealistic serving size that is one-fourth to one-half smaller than the average American child or teenager actually eats.
As a result, kids who eat a bowl of some sugary cereals could consume five to nine pounds more sugar a year than the labels may lead parents to believe, an EWG analysis found.1 In two years, when new federal guidelines for more realistic serving sizes kick in, none of the ten brands most frequently advertised to kids2––which collectively spent $208 million on television advertising in 20113––will meet the cereal industry's current self-imposed limits for sugar in cereals marketed to kids.

In May 2016 the FDA mandated an increase in serving sizes on cereal labels, but gave the industry more than two years to comply. In light of the nation’s childhood obesity epidemic, that’s too long. EWG is calling on manufacturers of the cereals most marketed to act now by changing their online product pages on their websites, and to move quickly to update the labels on cereal boxes.
“Breakfast cereals are the fifth-highest source of added sugar in the diets of children under 8, after sugary drinks, cookies, candy and ice cream,” EWG wrote in letters sent today to the CEOs of Kellogg’s, General Mills and Post, citing a 2010 study by the National Cancer Institute. “Now that FDA’s decision is final, you have an opportunity . . . to make a positive difference to the health of children and all Americans.”
Consumers who want the truth about added sugar don’t have to wait for the cereal companies to update their labels. Listings for cereals in EWG’s Food Scores now include an online calculator that lets users see how much sugar is in servings of different sizes that more accurately reflect what Americans eat.

The current FDA regulations were set in 1993. They say labels for the most common type of cereals must use a reference serving size of 30 grams, or about one ounce––what the average American ate in 1977. (Nutrition Facts labels also list serving sizes in a common household measure, such as cups or biscuits.) But anyone who has ever measured out a 3/4-cup standard serving of Honey Nut Cheerios or similar cereals knows that the serving sizes listed on nutrition tables are absurdly small. In the real world, most people fill their bowls with well over one of those miniscule servings.
Data from the National Health and Nutrition Examination Survey, or NHANES, show that today an average bowl of cereal in America is 39 grams, or a little over a cup.4 According to NHANES data from 2001 to 2006, it’s even more for children and adolescents. Their average serving ranges from 42 to 62 grams5––up to twice as high as the FDA’s current standard serving.6
That means that in the real world, a child who ate one average-sized bowl a day of one of the cereals most marketed to kids would consume 5.6 pounds to 9.3 pounds more sugar a year than the current labels could lead parents to believe (Appendix Table 1).
Even after the new standard takes effect, a big gap will remain between the sugar in an FDA-defined serving and what kids actually eat according to NHANES data (Table 1).
| Brand (Company) | Sugar in current FDA serving (grams) | Sugar in new FDA servinga | Sugar in 'Real World' Servingsb |
| Cinnamon Toast Crunch (General Mills) | 9 | 12 | 18 |
| Honey Nut Cheerios (General Mills) | 9 | 12 | 20 |
| Froot Loops (Kellogg's) | 10 | 15 | 17 |
| Reese's Puffs (General Mills) | 9 | 12 | 19 |
| Lucky Charms (General Mills) | 10 | 13 | 18 |
| Fruity Pebbles (Post) | 9 | 12 | 21 |
| Frosted Flakes (Kellogg's) | 10 | 13 | 17 |
| Trix (General Mills) | 10 | 13 | 19 |
| Cocoa Puffs (General Mills) | 10 | 13 | 18 |
| Cookie Crisp (General Mills) | 9 | 15 | 17 |
| Average | 9.5 | 13.2 | 18.5 |
Source: EWG, from FDA and NHANES data
a U.S Food and Drug Administration, Food Labeling: Serving Sizes of Foods That Can Reasonably Be Consumed at One-Eating Occasion . . . Federal Register, May 27, 2016. www.gpo.gov/fdsys/pkg/FR-2016-05-27/pdf/2016-11865.pdf
b Ann M. Albertson, et al., Weight indicators and nutrient intake in children and adolescents do not vary by sugar content in ready-to-eat cereal: results from National Health and Nutrition Examination Survey 2001-2006. Science Direct, March 2011. www.ncbi.nlm.nih.gov/pubmed/21481717
Kellogg’s,7 General Mills8 and Post9 are members of the Children’s Food and Beverages Advertising Initiative, a voluntary self-regulation program operated by the Council of Better Business Bureaus. Members of the initiative have agreed not to advertise any cereal with more than 10 grams of total sugars per serving to children under 12.10 That means that under the FDA’s current serving size standard, the initiative deems it OK to spend hundreds of millions of dollars a year on kid-targeted advertising of sugary cereals like Froot Loops, Cinnamon Toast Crunch and Fruity Pebbles.
But under FDA’s new standards, a serving of those three and seven other brands most heavily marketed to kids will have from 12 to 15 grams of sugar (Table 1). For General Mills’ Cinnamon Toast Crunch, this means a standard serving under the new rule will have 30 percent more sugar than current labels indicate. For some cereals, like Kellogg’s Froot Loops, the increase will be as high as 50 percent. Using the real-world average serving size determined by NHANES, the sugar content in a bowl of the most heavily marketed brands actually ranges from 17 to 21 grams (see Appendix Table 1).
What will cereal makers do in 2018 – reduce the sugar in their products or raise their self-imposed limit on brands marketed to children?
Findings from a 2011 study11 show that the industry is well aware that currently defined serving sizes mislead consumers about sugar. The study, paid for by General Mills and published in the journal Nutrition Research, shows the company knew children who ate a typical serving of sugary cereal consumed up to twice as much sugar as parents might assume from reading the nutrition label.
Using data from federal nutrition surveys, the study found that for 6-to-18-year-olds, the average serving of what researchers classified as medium-sugar cereal was 61.6 grams. For children who ate high-sugar cereal the average serving size was 49.1 grams. Yet the industry continues to market these cereals to children and to claim they contribute to a healthy diet.
According to the latest federal Dietary Guidelines for Americans from the Department of Health and Human and Services and Department of Agriculture, released last year, there is a “public health need to limit calories from added sugars” to protect against obesity and chronic disease.12 Added sugars add unneeded calories without delivering important nutrients for growing bodies.13 Excess sugar consumption has long been linked to tooth decay and more recently linked to higher risks of obesity, heart disease, Type 2 diabetes and some cancers.14
Added sugars lurk everywhere in the American diet. In 2014, when EWG first released Food Scores, 58 percent of the 80,000 foods in the database contained added sugars, and the average food was 13 percent sugar by weight. The average 6-to-11-year-old American boy eats 22 teaspoons of added sugar every day, and the average girl of that age consumes 18 teaspoons.15 This means many children consume double or even triple the maximum recommendation of six to 12 teaspoons a day.16
How much comes from cereal? A lot. Analysis of Food Scores data in 2014 found that children who ate an average serving of a typical children’s cereal would consume over 10 pounds of sugar a year from cereals alone.17 Among the 181 cereals in the database that were marketed for children, none were free of added sugars.
Through the Children’s Food and Beverages Advertising Initiative, the industry has made progress. Before the initiative began in November of 2006,18 cereals advertised to kids contained as much as 15 grams of sugar19 in the FDA's 30-gram reference serving size.
But while cereal companies have cut down on how much sugar can be in cereals marketed to kids, they're spending more and more to push their products to kids. In 2011, according to EWG calculations from Nielsen data reported in a 2012 study20 by the Rudd Center for Food Policy and Obesity:
It's time for cereal companies to own up to the impact on kids' health of their products and their marketing. The Children's Food and Beverages Advertising initiative supposedly "is designed to shift the mix of foods advertised to children under 12 to encourage healthier dietary choices and healthy lifestyles."21 If cereal makers are serious about that, they should provide accurate, timely and transparent information to parents, and decrease the advertising of these sugary cereals to kids.
| Brand (Company) | Percent Sugar by Weight (%) | Real World Serving Size (grams)a | Sugar in Real World Serving | Listed Sugar Content | Hidden Sugar per Bowl | Annual hidden sugar consumption (pounds) |
| Cinnamon Toast Crunch (General Mills) | 29% | 61.6 | 18 | 9 | 9 | 7 |
| Honey Nut Cheerios (General Mills) | 32% | 61.6 | 20 | 9 | 11 | 9 |
| Froot Loops (Kellogg's) | 34% | 49.1 | 17 | 10 | 7 | 6 |
| Reese's Puffs (General Mills) | 31% | 61.6 | 19 | 9 | 10 | 8 |
| Lucky Charms (General Mills) | 37% | 49.1 | 18 | 10 | 8 | 7 |
| Fruity Pebbles (Post) | 33% | 61.6 | 21 | 9 | 12 | 9 |
| Frosted Flakes (Kellogg's) | 34% | 49.1 | 17 | 10 | 7 | 6 |
| Trix (General Mills) | 31% | 61.6 | 19 | 10 | 9 | 7 |
| Cocoa Puffs (General Mills) | 37% | 49.1 | 18 | 10 | 8 | 7 |
| Cookie Crisp (General Mills) | 35% | 49.1 | 17 | 9 | 8 | 6 |
| Average | 33% | 55.4 | 18 | 10 | 9 | 7 |
Source: EWG, from cereal Nutrition Facts labels, NHANES data and 2011 General Mills-funded study.
EWG calculated that cereals like Cinnamon Toast Crunch, which is 29 percent sugar, would then have a mean serving size of 61.6 grams, providing 18 grams of sugar per bowl. Given that most parents likely interpret the sugar content on the Nutrition Facts panel to mean that a bowl of cereal contains 9 grams of sugar, that's 7 pounds more sugar a year consumed by their children than they might think.
(9 grams per bowl × 365 bowls of cereal a year = 3,285 grams per year ÷ 454 grams = 7 pounds).
a According to scientists at General Mills Bell Institute of Health and Nutrition, the amount of cereal children and teens eat differs by the sugar content of the cereal. Using data collected by the CDC for NHANES from 2001-2006, they found that cereals that were 17 to 33 percent sugar had a mean serving size of 61.6 grams, while cereals over 33 percent sugar had a mean serving size of 49.1 grams (Albertson 2011).
| Brand (Company) | 2011 TV adverstising spending (millions) | 2011 Total advertising spending (in millions) | 2008 Total advertising spending (in millions) | % increase from 2008 |
| Cinnamon Toast Crunch (General Mills) | $25.8 | $29.0 | $15.7 | 85% |
| Honey Nut Cheerios (General Mills) | $71.3 | $73.7 | $60.7 | 21% |
| Froot Loops (Kellogg's) | $28.2 | $35.7 | $7.9 | 352% |
| Reese's Puffs (General Mills) | $8.9 | $9.8 | $6.2 | 58% |
| Lucky Charms (General Mills) | $10.1 | $12.6 | $10.4 | 21% |
| Fruity Pebbles (Post) | $6.7 | $13.6 | $7.4 | 84% |
| Frosted Flakes (Kellogg's) | $40.1 | $40.6 | $18.4 | 121% |
| Trix (General Mills) | $7.5 | $7.9 | $6.8 | 16% |
| Cocoa Puffs (General Mills) | $7.0 | $7.1 | $7.8 | -9% |
| Cookie Crisp (General Mills) | $2.1 | $2.1 | $4.0 | -48% |
| Totala | $207.7 | $232.1 | $145.3 | 60% |
Source: Jennifer L Harris et al., Cereal FACTS 2012: Limited progress in the nutrition quality and marketing of children’s cereals. Available: http://www.cerealfacts.org/media/Cereal_FACTS_Report_2012_7.12.pdf (Relying on research data provided by Nielsen).
a EWG calculation based on Ranking Table 2 in Cereal FACTS 2012.
| Brand (Company) | Average number of ads viewed in 2011 | |
| Children (6-11 years) | Preschoolers (2-5 years) | |
| Cinnamon Toast Crunch (General Mills) | 72 | 61 |
| Honey Nut Cheerios (General Mills) | 67 | 59 |
| Froot Loops (Kellogg's) | 60 | 49 |
| Reese's Puffs (General Mills) | 60 | 52 |
| Lucky Charms (General Mills) | 56 | 49 |
| Fruity Pebbles (Post) | 52 | 39 |
| Frosted Flakes (Kellogg's) | 51 | 40 |
| Trix (General Mills) | 50 | 44 |
| Cocoa Puffs (General Mills) | 47 | 40 |
| Cookie Crisp (General Mills) | 21 | 18 |
| Totala | 536 | 451 |
Source: Jennifer L Harris et al., Cereal FACTS 2012: Limited progress in the nutrition quality and marketing of children’s cereals. Available: http://www.cerealfacts.org/media/Cereal_FACTS_Report_2012_7.12.pdf (Relying on research data provided by Nielsen).
a EWG calculation based on Ranking Table 3 in Cereal FACTS 2012.
1 See Appendix Table 1 for detailed calculations. For example, in the case of General Mills' Cinnamon Toast Crunch, this equates to consumers eating 30 percent more sugar than the package indicates. Right now, the Nutrition Facts label lists a serving size of ¾ cup (31grams), with 9 grams of sugar. But industry analysis of national government consumption data found that children and teens actually consume 42 to 62 grams of cereal, depending on the sugar content of the cereal. Cinnamon Toast Crunch is 29% sugar, so children eat about 61.6 grams on average, or 18 grams of sugar. If a child consumes a bowl of cereal a day, that’s 9 grams more sugar a day. Multiplied by 365 days, that’s 3,285 grams of sugar a year. There are 454 grams in a pound, so 3,285 grams per year ÷ 454 grams = 7 pounds more sugar a year.
2 Jennifer L Harris et al., Cereal FACTS 2012: Limited progress in the nutrition quality and marketing of children’s cereals. Available: http://cerealfacts.org/cereal_nutrition_advanced_search.aspx?l=tv
3 See Appendix Table 2.
4 Food and Drug Administration, Food Labeling: Serving Sizes of Foods That Can Reasonably Be Consumed at One-Eating Occasion . . . Federal Register, May 27, 2016. http://www.gpo.gov/fdsys/pkg/FR-2016-05-27/pdf/2016-11865.pdf
5 Ann M. Albertson, et al., Weight indicators and nutrient intake in children and adolescents do not vary by sugar content in ready-to-eat cereal: results from National Health and Nutrition Examination Survey 2001-2006. Science Direct, March 2011. http://www.ncbi.nlm.nih.gov/pubmed/21481717
6 http://www.accessdata.fda.gov/scripts/cdrh/cfdocs/cfcfr/cfrsearch.cfm?fr=101.12
7 https://www.bbb.org/council/for-businesses/advertising-review-services/childrens-food-and-beverage-advertising-initiative/company-pledges/kellogg-company/
8 https://www.bbb.org/council/for-businesses/advertising-review-services/childrens-food-and-beverage-advertising-initiative/company-pledges/general-mills-inc/
9 https://www.bbb.org/council/for-businesses/advertising-review-services/childrens-food-and-beverage-advertising-initiative/company-pledges/post-foods-llc/
10 https://www.bbb.org/globalassets/shared/media/cfbai/bbb_cfbai-cerealsnapshot-2015.pdf
11 Ann M. Albertson, et al., Weight indicators and nutrient intake in children and adolescents do not vary by sugar content in ready-to-eat cereal: results from National Health and Nutrition Examination Survey 2001-2006. Science Direct, March 2011. http://www.ncbi.nlm.nih.gov/pubmed/21481717
12 http://health.gov/dietaryguidelines/2015/guidelines/executive-summary/#footnote-2
13 H. Wang et al, Consistency between increasing trends in added sugar intake and body mass index among adults: the Minnesota Heart Survey, 1980-1982 to 2007-2009. American Journal of Public Health, June 2014.
14 http://health.gov/dietaryguidelines/2015/guidelines/chapter-1/a-closer-look-inside-healthy-eating-patterns/#added-sugars
15 R. Bethene Ervin et al, Consumption of added sugar among U.S. children and adolescents, 2005–2008. National Center for Health Statistics, February 2012. http://www.cdc.gov/nchs/data/databriefs/db87.htm
16 http://www.who.int/mediacentre/news/notes/2014/consultation-sugar-guideline/en/
17 http://www.ewg.org/research/childrens-cereals
18 http://www.bbb.org/storage/0/Shared%20Documents/BBB%20comment%20to%20FCC.pdf
19 https://www.bbb.org/globalassets/shared/media/cfbai/bbb_cfbai-cerealsnapshot-2015.pdf
20 Jennifer L Harris et al., Cereal FACTS 2012: Limited progress in the nutrition quality and marketing of children’s cereals. Available: http://www.cerealfacts.org/media/Cereal_FACTS_Report_2012_7.12.pdf
21 https://www.bbb.org/council/the-national-partner-program/national-advertising-review-services/childrens-food-and-beverage-advertising-initiative/

The Eat Well Guide helps consumers find locally grown and sustainably produced food. Listings include farms, restaurants, stores, farmers' markets, and CSAs throughout the United States.
Visit the Eat Well GuideSign up to receive email updates, action alerts, healthy eating tips, promotions to support our work and more from EWG! You can opt out at any time.


 EWG's Good Food on a Tight Budget
 EWG's Shopper's Guide to Pesticides in Produce
 EWG's Good Seafood Guide
 EWG's Healthy Living: Home Guide
 EWG's Tap Water Database
 EWG and Keep A Breast Foundation's Dirty Dozen List of Endocrine Disruptors