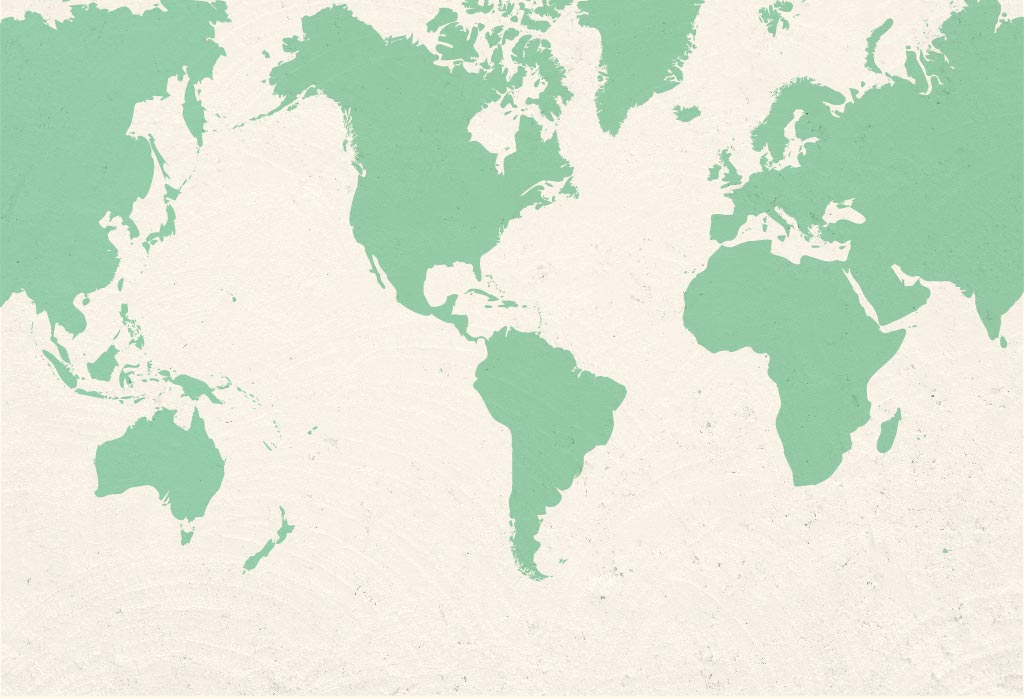

Top 20 Export Destinations
Top Undernourished Countries
Key
| Country | UN Human Development Score | FAO Hunger Score | |
|---|---|---|---|
| 1 | Canada | Very high | Very low |
| 2 | China | High | Moderately low |
| 3 | Mexico | High | Very low |
| 4 | European Union-28 | Very high | Very low |
| 5 | Japan | Very high | Very low |
| 6 | Korea, South | Very high | Very low |
| 7 | Hong Kong | Very high | Moderately low |
| 8 | Taiwan | No Data | Moderately low |
| 9 | Colombia | High | Moderately low |
| 10 | Philippines | Medium | Moderately low |
| 11 | Vietnam | Medium | Moderately low |
| 12 | Indonesia | Medium | Moderately low |
| 13 | Thailand | High | Moderately low |
| 14 | Australia | Very high | Very low |
| 15 | Turkey | High | Very low |
| 16 | Saudi Arabia | Very High | Very low |
| 17 | United Arab Emirates | Very high | Very low |
| 18 | India | Medium | Moderately High |
| 19 | Dominican Republic | High | Moderately low |
| 20 | Guatemala | Medium | Moderately High |
| Country | 2013 Export Value and Aid ($Million) | Share of Food Supply in 2013 | FAO Hunger Score | UN Human Development Score | |
|---|---|---|---|---|---|
| Haiti | 420.7 | 17% | Very high | Low | |
| Central African Republic | 19.1 | 2% | Very high | Low | |
| Namibia | 8.9 | 1% | Very high | Medium | |
| Zambia | 1.0 | <1% | Very high | Medium | |
| Liberia | 40.0 | 6% | High | Low | |
| Chad | 94.7 | 5% | High | Low | |
| Congo (Brazzaville) | 51.2 | 5% | High | Medium | |
| Zimbabwe | 44.6 | 2% | High | Low | |
| Swaziland | 6.6 | 7% | High | Low | |
| Mozambique | 59.4 | 1% | High | Low | |
| Madagascar | 9.7 | <1% | High | Low | |
| Tanzania | 58.2 | 1% | High | Low | |
| Rwanda | 8.4 | <1% | High | Low | |
| Uganda | 40.5 | 1% | High | Low | |
| Ethiopia | 281.9 | 2% | High | Low | |
| Yemen | 258.0 | 5% | High | Low | |
| Afghanistan | 112.4 | 2% | High | Low | |
| Tajikistan | 7.9 | <1% | High | Medium | |
| Timor-Leste | 0.5 | <1% | High | Medium |
FAO Hunger Score
More Very high More High More Moderately high More Moderately low More Very lowExport Value
$4 - $26 billion $2 - $4 billion $1 - $2 billion-
More
Close
U.S.A.
U.S.A.
-
More
Close
Canada
Value of 2015 U.S. Agriculture Exports$20.9BillionFAO
Hunger Score Very lowUN Human Development Score
 Very high
 -
More
Close
China
Value of 2015 U.S. Agriculture Exports$20.2BillionFAO
Hunger Score Moderately lowUN Human Development Score
 High
High -
More
Close
Mexico
Value of 2015 U.S. Agriculture Exports$17.7BillionFAO
Hunger ScoreVery lowUN Human Development ScoreHigh -
More
Close
European Union
Value of 2015 U.S. Agriculture Exports$12.1BillionFAO
Hunger ScoreVery lowUN Human Development ScoreVery high -
More
Close
Japan
Value of 2015 U.S. Agriculture Exports$11.2BillionFAO
Hunger ScoreVery lowUN Human Development ScoreVery high -
More
Close
South Korea
Value of 2015 U.S. Agriculture Exports$6.0BillionFAO
Hunger ScoreVery lowUN Human Development ScoreVery high -
More
Close
Hong Kong
Value of 2015 U.S. Agriculture Exports$3.6BillionFAO
Hunger ScoreModerately lowUN Human Development ScoreVery high -
More
Close
Taiwan
Value of 2015 U.S. Agriculture Exports$3.2BillionFAO
Hunger ScoreModerately lowUN Human Development Score No Data
 -
More
Close
Colombia
Value of 2015 U.S. Agriculture Exports$2.4BillionFAO
Hunger ScoreModerately lowUN Human Development ScoreHigh -
More
Close
Philippines
Value of 2015 U.S. Agriculture Exports$2.3BillionFAO
Hunger ScoreModerately lowUN Human Development Score Medium
 -
More
Close
Vietnam
Value of 2015 U.S. Agriculture Exports$2.2BillionFAO
Hunger ScoreModerately lowUN Human Development ScoreMedium -
More
Close
Indonesia
Value of 2015 U.S. Agriculture Exports$2.2BillionFAO
Hunger ScoreModerately lowUN Human Development ScoreMedium -
More
Close
Thailand
Value of 2015 U.S. Agriculture Exports$1.7BillionFAO
Hunger ScoreModerately lowUN Human Development ScoreHigh -
More
Close
Australia
Value of 2015 U.S. Agriculture Exports$1.4BillionFAO
Hunger ScoreVery lowUN Human Development ScoreVery high -
More
Close
Turkey
Value of 2015 U.S. Agriculture Exports$1.4BillionFAO
Hunger ScoreVery lowUN Human Development ScoreHigh -
More
Close
Saudi Arabia
Value of 2015 U.S. Agriculture Exports$1.3BillionFAO
Hunger ScoreVery lowUN Human Development ScoreVery High -
More
Close
United Arab Emirates
Value of 2015 U.S. Agriculture Exports$1.3BillionFAO
Hunger ScoreVery lowUN Human Development ScoreVery high -
More
Close
India
Value of 2015 U.S. Agriculture Exports$1.2BillionFAO
Hunger Score Moderately HighUN Human Development ScoreMedium
 -
More
Close
Dominican Republic
Value of 2015 U.S. Agriculture Exports$1.1BillionFAO
Hunger ScoreModerately LowUN Human Development ScoreHigh -
More
Close
Guatemala
Value of 2015 U.S. Agriculture Exports$1.1BillionFAO
Hunger ScoreModerately HighUN Human Development ScoreMedium -
More
Close
Liberia
Value of 2013 U.S. Agriculture Exports and Food Aid$40.0MillionShare of Food Supply in 20136%From U.SFAO
Hunger Score HighUN Human Development Score
 Low
Low -
More
Close
Haiti
Value of 2013 U.S. Agriculture Exports and Food Aid$420.7MillionShare of Food Supply in 201317%From U.SFAO
Hunger Score Very highUN Human Development ScoreLow
 -
More
Close
Timor-Leste
Value of 2013 U.S. Agriculture Exports and Food Aid$0.5MillionShare of Food Supply in 2013<1%From U.SFAO
Hunger ScoreHighUN Human Development ScoreMedium -
More
Close
Chad
Value of 2013 U.S. Agriculture Exports and Food Aid$94.7MillionShare of Food Supply in 20135%From U.SFAO
Hunger ScoreHighUN Human Development ScoreLow -
More
Close
Congo (Brazzaville)
Value of 2013 U.S. Agriculture Exports and Food Aid$51.2MillionShare of Food Supply in 20135%From U.SFAO
Hunger ScoreHighUN Human Development ScoreMedium -
More
Close
Yemen
Value of 2013 U.S. Agriculture Exports and Food Aid$258.0MillionShare of Food Supply in 20135%From U.SFAO
Hunger ScoreHighUN Human Development ScoreLow -
More
Close
Afghanistan
Value of 2013 U.S. Agriculture Exports and Food Aid$112.4MillionShare of Food Supply in 20132%From U.SFAO
Hunger ScoreHighUN Human Development ScoreLow -
More
Close
Ethiopia
Value of 2013 U.S. Agriculture Exports and Food Aid$281.9MillionShare of Food Supply in 20132%From U.SFAO
Hunger ScoreHighUN Human Development ScoreLow -
More
Close
Namibia
Value of 2013 U.S. Agriculture Exports and Food Aid$8.9MillionShare of Food Supply in 20131%From U.SFAO
Hunger ScoreVery highUN Human Development ScoreMedium -
More
Close
Zimbabwe
Value of 2013 U.S. Agriculture Exports and Food Aid$44.6MillionShare of Food Supply in 20132%From U.SFAO
Hunger ScoreHighUN Human Development ScoreLow -
More
Close
Mozambique
Value of 2013 U.S. Agriculture Exports and Food Aid$59.4MillionShare of Food Supply in 20131%From U.SFAO
Hunger ScoreHighUN Human Development ScoreLow -
More
Close
Swaziland
Value of 2013 U.S. Agriculture Exports and Food Aid$6.6MillionShare of Food Supply in 20137%From U.SFAO
Hunger ScoreHighUN Human Development ScoreLow -
More
Close
Tanzania
Value of 2013 U.S. Agriculture Exports and Food Aid$58.2MillionShare of Food Supply in 20131%From U.SFAO
Hunger ScoreHighUN Human Development ScoreLow -
More
Close
Madagascar
Value of 2013 U.S. Agriculture Exports and Food Aid$9.7MillionShare of Food Supply in 2013<1%From U.SFAO
Hunger ScoreHighUN Human Development ScoreLow -
More
Close
Uganda
Value of 2013 U.S. Agriculture Exports and Food Aid$40.5MillionShare of Food Supply in 20131%From U.SFAO
Hunger ScoreHighUN Human Development ScoreLow -
More
Close
Central African Republic
Value of 2013 U.S. Agriculture Exports and Food Aid$19.1MillionShare of Food Supply in 20132%From U.SFAO
Hunger ScoreVery highUN Human Development ScoreLow -
More
Close
Rwanda
Value of 2013 U.S. Agriculture Exports and Food Aid$8.4MillionShare of Food Supply in 2013<1%From U.SFAO
Hunger ScoreHighUN Human Development ScoreLow -
More
Close
Zambia
Value of 2013 U.S. Agriculture Exports and Food Aid$1.0MillionShare of Food Supply in 2013<1%From U.SFAO
Hunger ScoreVery highUN Human Development ScoreMedium -
More
Close
Tajikistan
Value of 2013 U.S. Agriculture Exports and Food Aid$7.9MillionShare of Food Supply in 2013<1%From U.SFAO
Hunger ScoreHighUN Human Development ScoreMedium