Summary — PCBs in farmed salmon
Seven of ten farmed salmon purchased at grocery stores in Washington DC, San Francisco, and Portland, Oregon were contaminated with polychlorinated biphenyls (PCBs) at levels that raise health concerns, according to independent laboratory tests commissioned by Environmental Working Group.
These first-ever tests of farmed salmon from U.S. grocery stores show that farmed salmon are likely the most PCB-contaminated protein source in the U.S. food supply. On average farmed salmon have 16 times the dioxin-like PCBs found in wild salmon, 4 times the levels in beef, and 3.4 times the dioxin-like PCBs found in other seafood. The levels found in these tests track previous studies of farmed salmon contamination by scientists from Canada, Ireland, and the U.K. In total, these studies support the conclusion that American consumers nationwide are exposed to elevated PCB levels by eating farmed salmon.
PCBs are persistent, cancer-causing chemicals that were banned in the United States in 1976 and are among the “dirty dozen” toxic chemicals slated for global phase-out under the United Nations Convention on Persistent Organic Pollutants, signed by President Bush on May 23, 2001. Because of their persistence, PCBs continue to contaminate the environment and the food supply.
A number of studies show that farmed salmon accumulate PCBs from the fishmeal they are fed. The feed is often designed to have high amounts of fish oil and is made largely from ground-up small fish. PCBs concentrate in oils and fat, and previous tests of salmon feed have consistently found PCB contamination.
If farmed salmon with the average PCB level found in this study were caught in the wild, EPA advice would restrict consumption to no more than one meal a month. But because farmed salmon are bought, not caught, their consumption is not restricted in any way.
This is because the EPA sets health guidance levels for PCBs in wild-caught salmon, and its standards, which were updated in 1999 to reflect the most recent peer-reviewed science, are 500 times more protective than the PCB limits applied by the Food and Drug Administration (FDA) to commercially-sold fish. The FDA has not updated its PCB health limit for commercial seafood since it was originally issued in 1984. In the intervening two decades new scientific research has shown that the PCBs that build up in fish and people are more potent cancer-causing agents than originally believed, and that they present other health risks as well, in particular neurodevelopmental risks to unborn children from maternal consumption of PCB-contaminated fish.
When the FDA’s standard was developed, salmon was something of a rarity in the U.S. diet. Today it is standard fare at home and in restaurants, particularly among consumers who are health-conscious, well educated, and relatively affluent. Last year salmon overtook “fish sticks” as the third most popular seafood in the American diet (trailing only tuna and shrimp). The increased consumption was made possible by the explosive growth in salmon farming, an industrial system that produces the fish in vast quantities at a price far lower than wild salmon.
Seven of the farmed salmon we tested came from factory-scale farms in Canada, the U.S., and Iceland. Six of these seven were polluted with PCBs at levels that would be safe to eat no more than once a month, according to EPA health standards. About 23 million Americans eat salmon more than once a month, the majority of it farmed salmon. One salmon imported from Scotland contained PCBs at levels so high that EPA would restrict consumption to no more than six meals a year, if the salmon were caught, not bought.
The farmed salmon industry claims that both farmed and wild salmon can be eaten safely more than once a week. This claim relies on FDA’s outdated contamination limit. In EWG’s testing program, nine of 10 farmed salmon tested from five countries of origin failed EPA’s health-based limits for weekly consumption (6000 parts per trillion), exceeding the standard by an average of 4.5 times. A pilot study published by Canadian scientists last year showed that farmed Canadian salmon contain ten times the PCBs of wild Alaskan and Canadian salmon.
EWG’s analysis of seafood industry fish consumption data shows that one quarter of all adult Americans (52 million people) eat salmon, and about 23 million of them eat salmon more often than once a month. Based on these data we estimate that 800,000 people face an excess lifetime cancer risk of more than one in 10,000 from eating farmed salmon, and 10.4 million people face a cancer risk exceeding one in 100,000. The government's preferred level of increased risk from contaminants like PCBs is no more than one in one million, a threshold set to account for a regulatory system that addresses chemicals or chemical classes individually and is unable to set safe levels for the complex mixtures of hundreds of industrial chemicals to which people are exposed.
Recommendations
Six of every ten salmon sold in stores and restaurants are raised in high-density fish pens in the ocean, managed and marketed by the salmon farming industry. These fish are eaten by a quarter of all adults in the U.S. and experts predict that the exponential growth of the farmed salmon industry will continue.
Farm-raised fish are here to stay. If raised correctly, these fish can help meet global demand for high-quality protein and take some of the pressure off of highly depleted populations of wild fish. But major reforms to the industry are needed.
In addition to the well documented ecological problems with salmon farming, there is now compelling evidence of near industry-wide contamination with unacceptably high levels of PCBs.
To remedy this problem, we recommend that:
- Congress pass a funding increase for FDA to support testing of farmed salmon and other protein sources for PCBs.
- The Food and Drug Administration move quickly to conduct a definitive study of PCB contamination in farmed salmon, and make all results public. This testing is critical, because FDA will be unable to update its regulation on PCBs in farmed salmon until the agency conducts its own laboratory studies.
- The FDA issue a PCB health advisory for seafood consumption in line with current PCB health guidance issued by the EPA.
- Policy-makers do more to preserve salmon habitat in Alaska, where, preliminary indications are, fish are naturally low in PCB contamination.
- The salmon farming industry monitor salmon feed for PCB contamination and shift or refine feed sources to produce fish lower in PCBs and other pollutants.
What you can do
To reduce your exposure to PCBs, trim fat from fish before cooking. Also, choose broiling, baking, or grilling over frying, as these cooking methods allow the PCB-laden fat to cook off the fish. When possible, choose wild and canned Alaskan salmon instead of farmed, and eat farmed salmon no more than once a month.
Wild versus farmed
Standard fish farming practices, which include the use of contaminated fishmeal and the intentional fattening of farmed stock, create a cascade of problems that ultimately drive down the nutrient content of farmed salmon, and drive up the contamination levels relative to wild-caught salmon.
Farmed salmon are fed contaminated fishmeal. Farmed salmon are fed from a global supply of fishmeal and fish oil manufactured from small open sea fish, which studies show are the source of polychlorinated biphenyls, or PCBs, in most farmed salmon. In three independent studies scientists tested 37 fishmeal samples from six countries, and found PCB contamination in nearly every sample (Jacobs 2002, Easton 2002, and CFIA 1999).
After testing fishmeal and fish oil, a team of U.K. scientists noted that “While diets based on marine fish oils are currently favored by the aquaculture industry, it is likely that these oils are contributing greatly to the contamination of farmed salmon by [persistent organic pollutants]” (Jacobs 2002b).
PCBs build up in salmon at 20 to 30 times the levels in their environment and their feed (Jackson et. al 2001), so even low concentrations of PCBs in fishmeal can become a concern for human health.
An expert food safety panel recently convened by the National Academy of Sciences noted that because of the “intensive management approach” of the aquaculture industry, PCBs in fishmeal can accumulate in fish tissues. The panel recommended that the government restrict the use of feed obtained from areas known to have high pollution levels (NAS 2003). Wild Alaskan salmon eat Pacific Ocean fish that the Academy scientists note are naturally lower in persistent pollutants.
Farmed salmon are intentionally fattened and can therefore accumulate more PCBs. The salmon farming industry intentionally fattens its fish to maximize market weight (Jacobs 2002), a process similar to fattening cows or hogs in a feed lot. As a result, an ounce of farmed salmon contains 52 percent more fat than an ounce of wild salmon, according to the U.S. Department of Agriculture (USDA 2002). PCBs collect in fat, as opposed to muscle or other organs. Farmed salmon, because they are intentionally fattened, are efficient collectors of PCBs. Leaner, wild Alaskan salmon are less likely to accumulate high levels of PCBs.
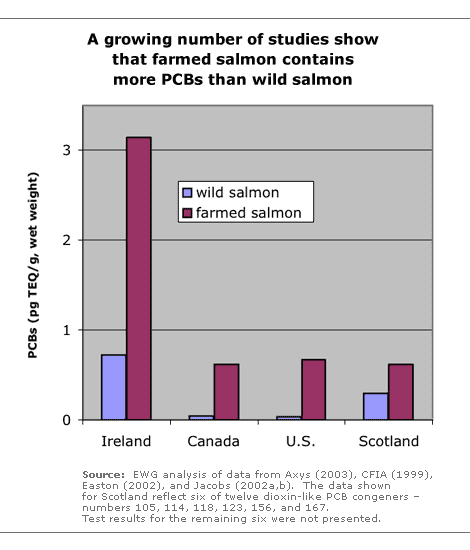
Farmed salmon contains five to 10 times the PCBs of wild salmon. EWG’s tests confirm findings from three prior, independent studies in which scientists observed differences in contaminant levels between farmed and wild salmon. The average level of total PCBs in EWG's ten farmed salmon samples was 27.3 ppb, or 5.2 times higher than the average PCB level of 5.3 ppb in four wild salmon tested by Canadian scientists (Easton et al. 2002). Differences in the 12 dioxin-like PCBs appear to be even greater. In Ireland, Scotland, British Columbia, and Alaska studies show higher concentrations of dioxin-like PCBs in farmed salmon than in wild salmon (Easton et al. 2002, FSIA 2002a and 2002b, Axys 2003, and Jacob et al. 2002). In most of these cases, wild salmon were harvested from environments relatively free of industrial pollution. Farmed fish raised in these same environments ate fishmeal with higher levels of PCBs than the native fish consumed by wild salmon (Figure).
Farmed salmon contains higher levels of many other persistent pollutants. An influential study published last year showed that PCBs are just one family in a complex mixture of persistent pollutants that appear to concentrate in farmed salmon. The Canadian scientists found that farmed salmon tissue contained significantly higher levels of 151 out of the 158 chemical contaminants that were detected in both farmed and wild salmon samples (Easton et al. 2002). In addition to 110 different PCBs, these chemicals included brominated flame retardants, organochlorine pesticides like DDT and dieldrin, and carcinogenic combustion byproducts called polynuclear aromatic hydrocarbons (PAHs). While PCBs may dominate human health risks from farmed salmon, many other contaminants contribute to the overall health concerns associated with these fish.
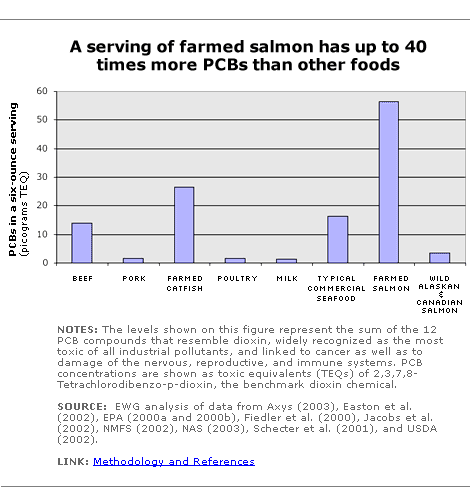
Farmed salmon may contain two to 40 times more PCBs than any other major protein source. An analysis of data from studies on dioxin-like PCBs in commercial seafood, beef, pork, milk, and poultry shows that farmed salmon may be more contaminated than any other protein source in the U.S. (NAS 2003, EPA 2002, Fiedler et al 2000). On average, farmed salmon from EWG’s supermarket study contained 40 times more PCBs than milk, 4 times the PCB levels of beef, and at least 3.4 times the PCB levels of other commercial seafood.
In their recent review of human exposures to dioxins and certain PCBs, an expert panel of the National Academy of Sciences noted that “it is in the public’s best interest for the government to develop a strategic action plan that includes interim steps to reduce exposures as long as the steps do not lead to undesirable consequences to human health,” and further recommended that the government focus on reducing exposures for girls and young women in the years well before pregnancy, since some PCBs are linked to brain damage and immune deficiencies for exposures in utero and in early childhood (NAS 2003). Although the Academy specifically recommends drinking skim instead of whole milk, even greater reductions of PCB exposures would be realized if women who eat farmed salmon ate wild salmon instead.
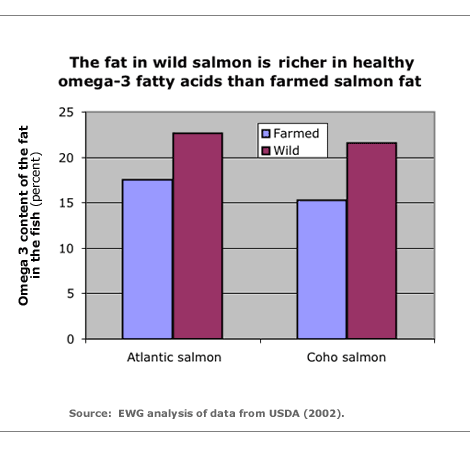
The fat in farmed salmon contains less healthy omega-3 fatty acids than the fat in wild salmon. Salmon fat is rich in omega-3 fatty acids, essential nutrients important to fetal brain development and linked to reductions in the occurrence or symptoms of autoimmune disease, headaches, cramps, arthritis, other inflammatory diseases, hardening of the arteries, Alzheimer's disease, and heart attacks. But USDA testing data show that the fat of farmed salmon contains an average of 35 percent less omega-3 fatty acids (USDA 2002).
Because farmed salmon contain 52% more total fat than wild salmon, the total omega-3 fatty acid content of farmed and wild fish is similar. However, in the case of farmed salmon, the fat is contaminated with PCBs and over 100 other pollutants and pesticides. Frequent farmed salmon eaters may exceed government health limits for these pollutants, which are linked to immune system damage, fetal brain damage, and cancer (Easton et al. 2002).
References
- Canadian Food Inspection Agency (CFIA). 1999. Summary report of contaminant results in fish feed, fishmeal and fish oil. Accessed online July 21, 2003 at http://www.inspection.gc.ca/english/anima/feebet/dioxe.shtml.
- Easton MD, Luszniak D, Von der GE. Preliminary examination of contaminant loadings in farmed salmon, wild salmon and commercial salmon feed. Chemosphere. 2002 Feb;46(7):1053-74.
- Fiedler H, Cooper K, Bergek S, Hjelt M, Rappe C, Bonner M, Howell F, Willett K, Safe S. PCDD, PCDF, and PCB in farm-raised catfish from southeast United States--concentrations, sources, and CYP1A induction. Chemosphere. 1998 Oct-Nov;37(9-12):1645-56.
- Food Safety Authority of Ireland (FSAI). 2002a. Summary of investigation of dioxins, furans, and PCBs in farmed salmon, wild salmon, farmed trout and fish oil capsules. March 2002. Accessed online July 21, 2003 at http://www.fsai.ie/industry/Dioxins3.htm.
- Food Safety Authority of Ireland (FSAI). 2002b. Investigation on PCDDs/PCDFs and several PCBs in fish samples (salmon and trout). Analysis and report provided by ERGO Forschungsgesellschaft mbH, Germany. Accessed online July 21, 2003 at http://www.fsai.ie/industry/Fishoilreport.pdf.
- Jackson LJ, Carpenter SR, Manchester-Neesvig J, Stow CA..PCB congeners in Lake Michigan coho (Oncorhynchus kisutch) and chinook (Oncorhynchus tshawytscha) salmon. Environ Sci Technol. 2001 Mar 1;35(5):856-62.
- Jacobs M, Ferrario J, Byrne C. 2002a. Investigation of polychlorinated dibenzo-p-dioxins, dibenzo-p-furans and selected coplanar biphenyls in Scottish farmed Atlantic salmon (Salmo salar). Chemosphere. 2002 Apr;47(2):183-91.
- Jacobs MN, Covaci A, Schepens P. 2002b. Investigation of selected persistent organic pollutants in farmed Atlantic salmon (Salmo salar), salmon aquaculture feed, and fish oil components of the feed. Environ Sci Technol. 2002 Jul 1;36(13):2797-805.
- National Academy of Sciences (NAS). 2003. Dioxins and dioxin-like compounds in the food supply: Strategies to decrease exposure. NAS Institute of Medicine, Food and Nutrition Board, Committee on the Implications of Dioxin in the Food Supply. The National Academies Press. Washington, D.C.
- U.S. Department of Agriculture, Agricultural Research Service. 2002. USDA National Nutrient Database for Standard Reference, Release 15. Nutrient Data Laboratory Home Page, http://www.nal.usda.gov/fnic/foodcomp.
Bought versus caught
Both the Food and Drug Administration and the Environmental Protection Agency have set health-based standards or guidance levels for PCBs in fish. EPA’s health guidance for PCBs, revised in 1999, applies to recreationally-caught fish (EPA 1999). Commercially-sold fish such as farmed salmon must instead comply with FDA’s 1984 PCB standard (FR 1984), which allows 500 times more PCB exposure than EPA’s current health-based guidance.
FDA’s standard, called a “tolerance,” legalizes the sale of salmon with PCB levels as high as 2 parts per million, a concentration that would trigger a strict warning to eat none of the fish were they caught in the wild and regulated by states that follow EPA’s guidance.
By comparing the PCB levels in our retail fish samples with the health standards published by the EPA, we found that, if caught recreationally, consumption of the seven most contaminated farmed salmon we bought and tested would be restricted to no more than one meal a month. But because farmed salmon are bought, not caught, consumption is not restricted in any way.
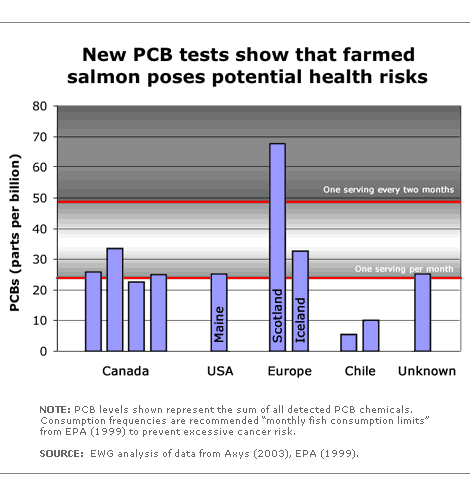
Six of the farmed salmon we tested came from factory-scale farms in Canada, the U.S. (Maine), and Iceland. For one other salmon sample we tested, the supplier was unable to ascertain the country of origin. All told, six of these seven were polluted with PCBs at levels that would be safe to eat no more than once a month, according to EPA health standards. About 23 million Americans eat salmon more than once a month, the majority of it farmed salmon. One salmon imported from Scotland contained PCBs at levels so high that EPA would restrict consumption to no more than 6 meals a year, if the salmon were caught, not bought.
EPA’s health standards are derived to protect the public from cancer risks in excess of 1 in 100,000, meaning that normal, expected exposures to the carcinogen would result in no more than one additional incidence of cancer per 100,000 people in the population. Our cancer risk analyses show that 10.4 million adults exceed this risk threshold by consuming PCB-laden farmed salmon, and that 800,000 adults exceed this risk level by 10-fold.
References
- Axys Analytical Services Ltd. 2003. Environmental Working Group. PCB congeners analysis; Tissue samples; Axys method: MLA-010 Rev04. Data Package: 4226 L5841-1 to -10. Report from Axys Analytical Services Ltd. to Environmental Working Group. July 2003.
- Environmental Protection Agency (EPA). 1999. Polychlorinated biphenyls (PCBs) update: Impact on fish advisories. EPA-823-F-99-019. Accessed online July 21 2003 at http://www.epa.gov/waterscience/fish/reports.html.
- Federal Register (FR). 1984. 49 FR 21514-21529.
PCBs cause cancer
There is broad agreement from multiple government agencies that PCBs are likely to cause cancer in people (ATSDR 2000). While agencies use different labels to describe the human cancer risk, ranging from “probable” or “probably,” to “reasonably anticipated,” the message is the same -- PCBs are expected to cause cancer in people.
Too few well-designed human studies have been conducted for these agencies to conclude whether PCBs are definite human carcinogens, but the data from laboratory animals are strong. Scientists from General Electric published a study in 1998 showing that all four commercial PCB mixtures tested, called Aroclors, caused cancer in rats (Mayes et al. 1998). Each commercial mixture was shown to cause liver tumors in females and thyroid tumors in male rats. Other studies have also shown that PCBs cause liver tumors (EPA 1996). One study, conducted by the National Cancer Institute (NCI) in 1978, found that a commercial PCB mixture caused a rare type of stomach tumor (gastric adenocarcinoma) in 6 of 144 exposed rats. This finding was statistically significant, since this type of tumor was found in only 1 of 3548 control male and female rats at NCI (IRIS 1997).
Most of the human cancer studies for PCBs are in exposed workers, or comparisons of PCB levels in people with and without certain types of cancer. Some of these studies show that workers exposed to PCBs may be more likely to die from cancers of the liver, biliary tract, intestines and skin. Less clear are associations with cancers of the brain, blood and lymphatic systems. Two studies have found that patients with non-Hodgkin’s lymphoma have higher levels of PCBs compared to healthy matched controls (ATSDR 2000).
Overall, the available human studies have limitations that prevent scientists from drawing definite conclusions about PCB exposure and cancer risk in people. For example, the human studies are often too small to detect statistically significant effects. Also, exposures to other factors that can alter cancer risk, such as smoking, obesity, alcohol consumption and other chemical exposures, can obscure potential PCB effects. For these and other reasons, EPA has concluded that the available human studies “are most appropriately viewed as inconclusive. Limited studies that produce inconclusive findings for cancer in humans do not mean that PCBs are safe” (EPA 2002).
Occupational and dietary mixtures of PCBs are not the same because PCBs can change in the environment. In general, the types of PCBs that bioaccumulate in fish and other animal products are more carcinogenic than commercial mixtures encountered by workers. As a result, people who ingest PCB-contaminated fish or other animal may be exposed to PCB mixtures that are even more toxic than the PCB mixtures contacted by workers and released into the environment (EPA 2002).
Notes: 1. The Environmental Protection Agency (EPA) considers PCBs to be “probable” human carcinogens, the International Agency for Research on Cancer (IARC) classifies PCBs as “probably” carcinogenic to people, and the National Toxicology Program refers to PCBs as “reasonably anticipated” human carcinogens.
References:
- Agency for Toxic Substances and Disease Registry (ATSDR). 2000. Toxicological profile for polychlorinated biphenyls (Arochlors -1260, -1254, -1248, -1242, -1232, -1221, and -1016 (update). Available online at http://www.atsdr.cdc.gov/toxprofiles/tp7.html.
- Environmental Protection Agency (EPA). 1996. PCBs: Cancer Dose-Response Assessment and Applications to Environmental Mixtures. National Center for Environmental Assessment, Office of Research and Development. EPA/600/P-96/00.
- Environmental Protection Agency (EPA). 2002. Health effects of PCBs. Available online at http://www.epa.gov/opptintr/pcb/effects.html.
- Integrated Risk Information System (IRIS). 1997. Polychlorinated biphenyls (PCBs) [CAS Number 1336-36-3]. Available online at http://toxnet.nlm.nih.gov/.
- Mayes, BA., McConnell, EE., Neal, BH., Brunner, MJ., Hamilton, SB., Sullivan, TM., Peters, AC., Ryan, MJ., Toft, JD., Singer, AW., Brown, JF, Jr.., Menton, RG and Moore, JA. 1998. Comparative carcinogenicity in Sprague-Dawley rats of the polychlorinated biphenyl mixtures Aroclors 1016, 1242, 1254, and 1260. Toxicol Sci 41 (1): 62-76.
PCBs alter brain development
Six of seven major epidemiology studies conducted over the past decade report that infants and children with higher PCB exposures during development score lower on numerous measures of neurological function, ranging from decreased IQ scores to reduced hearing sensitivity (Schantz et al. 2003).
Some of these effects have been noted at low levels. A study of Michigan children found that PCBs at 9.7 ng/ml (parts per billion or ppb) in maternal serum during fetal development can cause adverse brain development, and attention and IQ deficits that appear to be permanent (Jacobson et al. 1996). Notably, it was the maternal PCB levels, and not the PCB levels in children at 4 and 11 years of age (by which time child PCB levels had decreased substantially), that was associated with IQ deficit, underscoring the importance of in utero exposures from a mother's consumption of PCB-contaminated fish. PCBs have also been linked with altered levels of thyroid hormones in Dutch and Japanese infants (EPA 2002). Thyroid hormones are critical for proper growth and brain development.
Children from two studies, the Michigan and Dutch cohorts, with higher cord blood levels of PCBs were also found to have lower body weight at birth and/or later in childhood (Patandin et al. 1998, Schantz et al. 2003). Low birth weight is increasingly recognized as a risk factor for insulin resistance or Type II diabetes, high blood pressure, and cardiovascular disease later in life (Godfrey et al. 2001, Hales et al. 2001). Even if these lower birth weight babies “catch up” later, the damage may have already been done. A substantial number of studies have found that low birth weight followed by an accelerated growth rate during childhood is a significant risk factor for high blood pressure, stroke, insulin resistance and glucose intolerance (Eriksson et al. 2000a, Eriksson et al. 2002a, Eriksson et al. 2000b, Eriksson et al. 1999, Eriksson et al. 2002b, Forsen et al. 2000, Ong et al. 2002).
New data, slated for publication in the August 2003 issue of Environmental Health Perspectives, found that male babies were more likely to have low birth weight if their mothers lived in zip codes that contain, or are next to, a PCB-contaminated hazardous waste site (Baibergenova et al. 2003). A similar effect was noted for female babies, but the effect was not as strong and did not reach statistical significance.
PCBs have long been known to damage the immune system in laboratory animals. In fact, the studies conducted to date have not been able to find a PCB dose that does not impact the immune system (EPA 2002). The animal studies show that PCBs can alter the size of important immune organs, impair the development of immunity and increase vulnerability to infections.
Overall, the available human studies also show that PCBs impair the immune system. A number of studies have shown that exposure to PCBs, especially early in life, appears to make people more susceptible to chicken pox or infections like those of the inner ear and respiratory tract (ATSDR 2000, Weisglas-Kuperus et al. 2000). Other findings include decreased levels of antibodies and lymphocytes, which are critical in mediating proper immune response (ATSDR 2000).
References:
- Agency for Toxic Substances and Disease Registry (ATSDR). 2000. Toxicological profile for polychlorinated biphenyls (Arochlors -1260, -1254, -1248, -1242, -1232, -1221, and -1016 (update). Available online at http://www.atsdr.cdc.gov/toxprofiles/tp7.html.
- Baibergenova, A., Kudyakov, R., Zbed, M and Carpenter, DO. 2003. Low birth weight and residential proximity to PCB-contaminated waste sites. Environ Health Perspect 111 (10): 1352-1357.
- Environmental Protection Agency (EPA). 2002. Health effects of PCBs. Available online at http://www.epa.gov/opptintr/pcb/effects.html.
- Eriksson, J., Forsen, T., Tuomilehto, J., Osmond, C and Barker, D. 2000a. Fetal and childhood growth and hypertension in adult life. Hypertension 36 (5): 790-4.
- Eriksson, JG., Forsen, T., Tuomilehto, J., Jaddoe, VW., Osmond, C and Barker, DJ. 2002a. Effects of size at birth and childhood growth on the insulin resistance syndrome in elderly individuals. Diabetologia 45 (3): 342-8.
- Eriksson, JG., Forsen, T., Tuomilehto, J., Osmond, C and Barker, DJ. 2000b. Early growth, adult income, and risk of stroke. Stroke 31 (4): 869-74.
- Eriksson, JG., Forsen, T., Tuomilehto, J., Winter, PD., Osmond, C and Barker, DJ. 1999. Catch-up growth in childhood and death from coronary heart disease: longitudinal study. Bmj 318 (7181): 427-31.
- Eriksson, JG and Forsen, TJ. 2002b. Childhood growth and coronary heart disease in later life. Ann Med 34 (3): 157-61.
- Forsen, T., Eriksson, J., Tuomilehto, J., Reunanen, A., Osmond, C and Barker, D. 2000. The fetal and childhood growth of persons who develop type 2 diabetes. Ann Intern Med 133 (3): 176-82.
- Godfrey, KM and Barker, DJ. 2001. Fetal programming and adult health. Public Health Nutr 4 (2B): 611-24.
- Hales, CN and Barker, DJ. 2001. The thrifty phenotype hypothesis. Br Med Bull 60: 5-20.
- Jacobson, JL and Jacobson, SW. 1996. Intellectual impairment in children exposed to polychlorinated biphenyls in utero. N Engl J Med 335 (11): 783-9.
- Ong, KK and Dunger, DB. 2002. Perinatal growth failure: the road to obesity, insulin resistance and cardiovascular disease in adults. Best Pract Res Clin Endocrinol Metab 16 (2): 191-207.
- Patandin, S., Koopman-Esseboom, C., de Ridder, MA., Weisglas-Kuperus, N and Sauer, PJ. 1998. Effects of environmental exposure to polychlorinated biphenyls and dioxins on birth size and growth in Dutch children. Pediatr Res 44 (4): 538-45.
- Schantz, SL., Widholm, JJ and Rice, DC. 2003. Effects of PCB exposure on neuropsychological function in children. Environ Health Perspect 111 (3): 357-576.
- Weisglas-Kuperus, N., Patandin, S., Berbers, GA., Sas, TC., Mulder, PG., Sauer, PJ and Hooijkaas, H. 2000. Immunologic effects of background exposure to polychlorinated biphenyls and dioxins in Dutch preschool children. Environ Health Perspect 108 (12): 1203-7.
Farmed salmon & cancer
To better understand the health impacts of PCBs in farmed salmon, the Environmental Working Group conducted the first-ever exposure and risk assessment of PCB contamination in farmed salmon. The analysis is based on published, peer-reviewed EPA conclusions on the toxicity and cancer potency of PCBs, and is made possible by state-of-the-art fish consumption data derived from 20,000 adults over the twelve-year period from 1990 through 2002. It assumes the farmed salmon is the only source of PCB exposure in the diet and that people are not exposed to any other pollutants that could exacerbate the cancer risks of PCBs.
The results of this analysis show:
- About 23 million people eat salmon at least once a month. Roughly 1.3 million people eat salmon once a week. Based on these data we estimate that 800,000 people face an excess lifetime cancer risk of more than one in 10,000 from eating farmed salmon, and 10.4 million people face a cancer risk exceeding one in 100,000 - the allowable risk threshold the government has selected for PCBs in recreationally caught fish. The government's preferred risk threshold for contaminants like PCBs is one in 1,000,000, but in the case of PCBs high background levels in the environment force selection of a higher risk threshold.
- PCB levels in farmed salmon would have to drop about 90 percent (to the levels found in wild salmon) to protect heavy salmon eaters (two meals per week), from unsafe exposures to PCBs.
Table. Millions of adults face an excessive cancer risk from PCBs in farmed salmon.
|
Number of adults facing unacceptably high cancer risk from eating farmed salmon |
Excess lifetime cancer risk from PCBs in farmed salmon |
|
16,000 |
> 1 in 1,000 |
|
800,000 |
> 1 in 10,000 |
|
10,400,000 |
> 1 in 100,000 |
|
34,200,000 |
> 1 in 1,000,000 |
|
Federal limit for acceptable upperbound cancer risk from a chemical contaminant |
1 in 1,000,000 |
Source: Exposure and risk analysis conducted by EWG, based on data from Axys (2003).
Contaminated fish meal
In 2001 about 80 percent of the farmed salmon consumed in the U.S. was imported from Canada and Chile (44 and 36 percent, respectively). An estimated 11 percent was raised domestically, and the remaining nine percent came from Norway, the U.K, China and 28 other countries (NMFS 2002).
These fish are fed from a global supply of fishmeal and fish oil widely traded between countries and manufactured from small pelagic, or open sea, fish including Peruvian anchoveta, Icelandic herring, menhaden from the Gulf of Mexico, Norweigian capelin, and sand eels from the North Sea. Iceland, Peru, Chile, and Denmark lead the world in production of fishmeal and fish oil (Tibbetts 2001). The global movement of fishmeal is illustrated by data on U.S. imports and exports of fishmeal: in 2001 the U.S. imported 51 million kilograms of fishmeal from 16 countries, and exported 108 million kilograms to 40 countries (NMFS 2002).
In three independent studies scientists tested 37 fishmeal and fish feed samples from six countries, and found PCB contamination in nearly every sample (Jacobs 2002, Easton 2002, and CFIA 1999). Although the data are too limited to carry statistical significance, PCB concentrations in fishmeal were highest on average in the Scottish samples, followed by samples from Canada, the United States, Russia, Iceland, and Peru, in order of decreasing levels. PCBs build up in salmon at 20 to 30 times the levels in their feed and surrounding environment (Jackson et. al 2001), so even low concentrations of PCBs in fishmeal can become a concern for human health.
In June 2003 the National Academy of Sciences issued a landmark study calling for broad changes in farming practices and human eating patterns to reduce human exposures to PCBs and other dioxin-like contaminants (DLCs) in the food supply, noting that because of the “intensive management approach” of the fish farming industry, even low levels of PCBs in fishmeal can accumulate in fish tissues.
Further, the Academy found that for fishmeal derived from the Atlantic Ocean and Gulf of Mexico, levels of PCBs and other DLCs are uncontrollable, stating that “...there is presently no known intervention that can lower the DLC levels in these fish,” raising the importance of the farmed salmon industry identifying clean feed sources for their product. The Academy recommended that the government conduct studies to find the distribution of PCBs and other contaminants in animal feed; and that the government, in collaboration with the animal production industry, identify ways to reduce contaminated fats as a component of feed, restricting the use of feed obtained from areas known to have high pollution levels (NAS 2003).
References
- National Marine Fisheries Service (NMFS). 2002. Foreign Trade Information. The Fisheries Statistics & Economics Division.. Import and export statistics available online at http://www.st.nmfs.gov/st1/trade/index.html.
- National Academy of Sciences (NAS). 2003. Dioxins and dioxin-like compounds in the food supply: Strategies to decrease exposure. NAS Institute of Medicine, Food and Nutrition Board, Committee on the Implications of Dioxin in the Food Supply. The National Academies Press. Washington, D.C.
- Tibbetts, John. 2001. Aquaculture: Satisfying the global appetite. Environmental Health Perspectives. 109(7).
Farmed salmon consumption is up
According to a farmed salmon industry source, 22 percent of all retail-seafood-counter dollars comes from farmed salmon (Redmayne, 2000). From a market dominated by wild salmon just ten years ago, now six of every ten salmon fillets sold in stores and restaurants are from fish raised in high-density pens in the ocean, managed and marketed by the salmon farming industry.
Based on our analysis of state-of-the-art fish consumption data derived from 20,000 adults over the twelve-year period from 1990 through 2002, we find:
- All told, one-quarter of all adults eat salmon at least occasionally. About 23.1 million people eat salmon more often than once a month, 1.3 million people eat salmon at least once a week, and an estimated 180,000 people eat salmon more often than twice a week.
- Salmon is more likely to be eaten by the rich and the well-educated. Salmon consumption correlates strongly with both household income and the education level of the woman who heads the household. For instance, adults from households with at least a $70,000 yearly income, and headed by a woman with a college degree, are 3.7 times as likely to eat salmon as are households with $30,000 yearly incomes headed by women who hold a high school diploma but not a college degree (Figure).
References
- Redmayne, Peter. 2000. Farmed salmon. As world harvests approach 1 million tons, the industry consolidates to keep up with spiraling demand. SeaFood Business. August 2000.
Recommendations
- For consumers, choose wild and canned salmon instead of farmed, and eat an eight-ounce serving of farmed salmon no more than once a month. Trim fat from fish before cooking, and choose broiling, baking, or grilling over frying, as these cooking methods allow the PCB-laden fat to cook off the fish.
- Congress should pass a funding increase for FDA to support testing of farmed salmon and other protein sources for PCBs, and to review the PCB standard for salmon and other commercial seafood, with a view toward achieving convergence on the more protective and contemporary EPA standard.
- The Food and Drug Administration must move quickly to conduct a definitive study of PCB contamination in farmed salmon, and make all results public. This testing is critical, since FDA will be unable to regulate PCBs in farmed salmon until they conduct these studies. FDA is charged with ensuring that commercially-sold seafood is safe to eat, but currently has little data on the distribution of PCB concentrations in the farmed salmon supply. The FDA’s existing testing program targets a handful of fish a year and does not provide the FDA with the data needed to assess potential public health impacts for the estimated 52 million Americans eating salmon. Testing carries heightened importance because of the rapid growth of farmed salmon consumption, increasing population-wide at an average yearly rate of 0.16 pounds per person (NFI 2001).
- The FDA must issue a PCB health advisory for seafood consumption in line with current PCB health guidance issued by the EPA.
- The farmed salmon industry should shift aquaculture practices to produce fish lower in PCBs. Farmed salmon carry higher PCB loads not only because the fish fat itself contains more PCBs, but because the salmon farming industry intentionally fattens the fish to maximize market weight (Jacobs 2002). Data from the U.S. Department of Agriculture shows that farmed salmon contain 52 percent more fat than wild (USDA 2002). Salmon fat itself can be a rich source of omega-3 fatty acids, essential nutrients important to fetal brain development and linked to reductions in the occurrence or symptoms of headaches, cramps, arthritis, autoimmune disease, other inflammatory diseases, hardening of the arteries, and heart attacks. However, by consuming too much farmed salmon, some people in the U.S. may be exceeding government guidelines to protect against immune system damage, fetal brain damage, and cancer associated with the PCBs that lace salmon fat.
- The federal government should regulate salmon farming practices to protect wild salmon populations. Currently, standard salmon farming practices can endanger wild salmon populations through environmental pollution (feces, pesticides, and antibiotics), through the spread of pathogens and parasites from tightly-packed fishpens to surrounding waters, and through the accidental but common release of non-native species that could interbreed with and overrun native salmon populations. Wild Pacific salmon are a unique, healthy resource that cannot be duplicated in a fish farm, and that stand to be harmed by current farming practices.