An estimated 19,000 children under age six in Ohio have unsafe levels of lead in their blood, according to a new analysis by the Environmental Working Group (EWG) that identifies high-risk counties and neighborhoods across the state. The study is based on lead poisoning risk criteria from the federal Centers for Disease Control and Ohio state health officials. Less than one third of these 19,000 children, just 5,700, have been identified and reported to the state by health care providers. This dramatic undercounting of lead poisoned children in Ohio is primarily due to the pervasive failure of doctors and HMOs to test children for lead. A law mandating testing of children in state designated high risk zip codes went into effect in Ohio on April 1, 2004.
Findings
SEVEN COUNTIES ARE HOME TO OVER HALF OF OHIO'S LEAD POISONED CHILDREN
| County | Estimated Children Poisoned |
|---|---|
| Cuyahoga | 4,011 |
| Franklin | 1,495 |
| Hamilton | 1,489 |
| Lucas | 996 |
| Montgomery | 960 |
| Summit | 887 |
| Stark | 594 |
| Total | 10,432 |
- More than half of the lead poisoned children in Ohio — some 10,400 children — live in seven metropolitan counties that contain the largest cities in the state.
- Statewide, only one of every seven children ages one through five was tested for blood lead levels in 2002. In no county did testing rates exceed thirty percent.
- In 58 of 88 counties in Ohio, at least 90% of children with a blood lead level above 10 ug/dL have not been identified because of low testing rates in these counties.
- Half of the lead poisoned children in Ohio who were not identified live in just 9 counties.
This failure to test children for lead translates into a dramatic undercounting of the number of lead poisoned children in Ohio. The resulting undercount ensures that high-risk housing is not identified, which in turn undermines support for critical lead paint remediation efforts. Prevention is the cornerstone of any effective effort to eliminate lead poisoning in the future.
Lead is a proven neurotoxin that causes permanent loss of IQ and other brain damage at low levels of exposure, especially in children. The primary source of lead in the environment is lead paint in older homes, particularly those constructed before 1950. The small bits of flaking paint become lead-contaminated house dust that can stick to skin. Children eat flakes of paint, or ingest lead-contaminated dust each time they put their hands in their mouths or directly mouth a surface coated with dust.
 |
| Percentage of Children Lead Poisoned by County [Click for more detail] |
Urban counties are not the only areas where children are at risk. Seven of the ten counties with the highest percentage of children under six with unsafe amounts of lead in their blood are rural counties in the southeastern portion of the state. On average three out of every 100 children under age six in these counties has a blood lead level above 10 µg/dL.
EWG identified 224 zip codes in 51 counties that contain neighborhoods where more than five percent of children under age six are lead poisoned based on the current 10 ug/dL standard.
Table: Zip Code Hotspots
A growing body of science indicates that levels of lead thought to be safe by government health officials are, in fact, quite hazardous. Research results published in the New England Journal of Medicine in April, 2003 showed an average IQ decline of 7.4 points for children with blood lead levels currently deemed safe — 10 micrograms of lead per deciliter of blood (10 µg/dL) — when compared to children with blood lead levels less than 1 (Canfield et al. 2003). The estimate here of 19,000 lead poisoned children in Ohio considers only children with blood lead levels over 10 µg/dL. If the effects of lead poisoning at lower levels were included, thousands of additional children across Ohio could be affected.
Failing to prevent lead poisonings costs Ohio approximately $230 million a year in remedial education costs and lost taxes on future incomes. A new Ohio law requires universal testing of children in high risk neighborhoods, but the Bush Administration's 2005 budget recommends a 20 percent cut in support for lead poisoning prevention programs, including testing, which could severely hamper state efforts.
Federal law requires all health care providers that treat Medicaid children to test these patients for lead. Nearly half (48 percent) of children under age six in Ohio are eligible for Medicaid. It appears, however, that many health care providers receive payment for lead testing - which is paid in a lump sum that includes other services - but fail to do the tests or ensure that they are done. A 2003 report by the Ohio Department of Jobs and Family Services found pervasive failure on the part of Managed Care Health providors to test one and two year olds for blood lead levels. Not a single managed health care provider in the state tested more than one-third of two year olds on Medicaid in the period of 2000 to 2002. In some counties the testing rates are even worse.
Figure 1: California requires reporting of poisoning cases only when blood lead levels are 2.5 times the amount that can damage children's health.
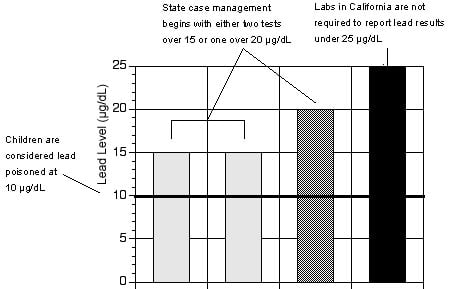
Source: Environmental Working Group, from state health department regulations.
Recommendations
Although progress has been made in reducing the percentage of children under age six with unsafe levels of lead in the blood, more than 19,000 children were lead poisoned in Ohio this year alone. No region or county in the state was spared, and no community was left untouched by this silent plague.
To ensure that future generations will not suffer the effects of lead poisoning that continue to cut short the potential of thousands of children today, we recommend:
- A major increase in support for primary prevention efforts to remove lead paint from childrens' environments in Ohio.
- Full enforcement of both federal and state lead testing requirements, with substantial fines for violators. Money from fines should be used to support lead paint remediation efforts.
- Mandatory reporting and public disclosure of all blood lead results (without identifying information), not just results above 10 µg/dL.
- A tightening, at the federal level, of the criteria for lead poisoning from 10 µg/dL, to 5 µg/dL.
County Summary
There are more than 19,000 lead-poisoned children in ohio.
| County (City) |
Total Children Ages 1 Through 5 | Children Screened (Percent) |
Confirmed Lead Poisoned | Estimated Lead Poisoned | Estimated Lead Poisoned Children Missed (Percent) |
|---|---|---|---|---|---|
| ADAMS | 1,675 | 330 (20) | 2 | 36 | 34 (94) |
| ALLEN | 7,022 | 947 (13) | 34 | 206 | 172 (84) |
| ASHLAND | 3,458 | 302 (9) | 8 | 76 | 68 (89) |
| ASHTABULA | 6,603 | 703 (11) | 31 | 185 | 154 (83) |
| ATHENS | 2,977 | 758 (25) | 11 | 77 | 66 (86) |
| AUGLAIZE | 3,120 | 195 (6) | 1 | 58 | 57 (98) |
| BELMONT | 3,500 | 532 (15) | 15 | 110 | 95 (86) |
| BROWN | 2,949 | 349 (12) | 3 | 56 | 53 (95) |
| BUTLER | 23,018 | 1,208 (5) | 11 | 387 | 376 (97) |
| CARROLL | 1,844 | 132 (7) | 1 | 41 | 40 (98) |
| CHAMPAIGN | 2,590 | 341 (13) | 5 | 53 | 48 (91) |
| CLARK | 9,699 | 2,540 (26) | 151 | 269 | 118 (44) |
| CLERMONT | 13,182 | 907 (7) | 8 | 179 | 171 (96) |
| CLINTON | 2,751 | 226 (8) | 2 | 50 | 48 (96) |
| COLUMBIANA | 6,941 | 839 (12) | 22 | 191 | 169 (88) |
| COSHOCTON | 2,338 | 270 (12) | 8 | 56 | 48 (86) |
| CRAWFORD | 3,048 | 294 (10) | 6 | 85 | 79 (93) |
| CUYAHOGA (Cleveland) |
91,520 | 26,239 (29) | 3,293 | 4,011 | 718 (18) |
| DARKE | 3,533 | 319 (9) | 5 | 76 | 71 (93) |
| DEFIANCE | 2,653 | 292 (11) | 5 | 47 | 42 (89) |
| DELAWARE | 9,088 | 334 (4) | 1 | 66 | 65 (98) |
| ERIE | 4,773 | 344 (7) | 26 | 114 | 88 (77) |
| FAIRFIELD | 8,727 | 822 (9) | 12 | 131 | 119 (91) |
| FAYETTE | 1,914 | 200 (10) | 5 | 47 | 42 (89) |
| FRANKLIN (Columbus) |
75,994 | 11,224 (15) | 145 | 1,495 | 1,350 (90) |
| FULTON | 3,219 | 193 (6) | 1 | 51 | 50 (98) |
| GALLIA | 1,955 | 505 (26) | 5 | 48 | 43 (90) |
| GEAUGA | 6,306 | 233 (4) | 1 | 97 | 96 (99) |
| GREENE | 8,929 | 564 (6) | 2 | 156 | 154 (99) |
| GUERNSEY | 2,782 | 450 (16) | 8 | 87 | 79 (91) |
| HAMILTON (Cincinnati) |
56,682 | 8,089 (14) | 410 | 1,489 | 1,079 (72) |
| HANCOCK | 5,065 | 92 (2) | 1 | 103 | 102 (99) |
| HARDIN | 2,161 | 211 (10) | 2 | 58 | 56 (97) |
| HARRISON | 939 | 207 (22) | 2 | 29 | 27 (93) |
| HENRY | 1,966 | 204 (10) | 4 | 42 | 38 (90) |
| HIGHLAND | 2,998 | 433 (14) | 12 | 68 | 56 (82) |
| HOCKING | 1,969 | 301 (15) | 1 | 44 | 43 (98) |
| HOLMES | 3,883 | 97 (3) | 4 | 90 | 86 (96) |
| HURON | 4,653 | 799 (17) | 10 | 105 | 95 (90) |
| JACKSON | 2,154 | 408 (19) | 0 | 54 | 54 (100) |
| JEFFERSON | 4,043 | 706 (17) | 20 | 142 | 122 (86) |
| KNOX | 3,356 | 244 (7) | 6 | 80 | 74 (93) |
| LAKE | 14,032 | 1,293 (9) | 14 | 232 | 218 (94) |
| LAWRENCE | 3,892 | 600 (15) | 3 | 98 | 95 (97) |
| LICKING | 10,300 | 902 (9) | 15 | 184 | 169 (92) |
| LOGAN | 3,162 | 205 (6) | 7 | 62 | 55 (89) |
| LORAIN | 20,334 | 3,150 (15) | 81 | 454 | 373 (82) |
| LUCAS (Toledo) |
31,466 | 4,882 (16) | 368 | 996 | 628 (63) |
| MADISON | 2,557 | 382 (15) | 5 | 51 | 46 (90) |
| MAHONING (Youngstown) |
15,625 | 2,709 (17) | 274 | 490 | 216 (44) |
| MARION | 4,094 | 528 (13) | 7 | 114 | 107 (94) |
| MEDINA | 10,977 | 1,012 (9) | 6 | 127 | 121 (95) |
| MEIGS | 1,197 | 324 (27) | 3 | 39 | 36 (92) |
| MERCER | 2,972 | 92 (3) | 0 | 49 | 49 (100) |
| MIAMI | 6,560 | 594 (9) | 10 | 128 | 118 (92) |
| MONROE | 815 | 69 (8) | 6 | 20 | 14 (70) |
| MONTGOMERY (Dayton) |
37,233 | 3,817 (10) | 63 | 960 | 897 (93) |
| MORGAN | 1,014 | 211 (21) | 14 | 33 | 19 (58) |
| MORROW | 2,181 | 122 (6) | 4 | 42 | 38 (90) |
| MUSKINGUM | 5,796 | 1,748 (30) | 68 | 163 | 95 (58) |
| NOBLE | 740 | 86 (12) | 5 | 18 | 13 (72) |
| OTTAWA | 2,331 | 249 (11) | 3 | 43 | 40 (93) |
| PAULDING | 1,335 | 84 (6) | 1 | 28 | 27 (96) |
| PERRY | 2,599 | 517 (20) | 4 | 62 | 58 (94) |
| PICKAWAY | 3,252 | 276 (8) | 0 | 66 | 66 (100) |
| PIKE | 1,952 | 180 (9) | 0 | 50 | 50 (100) |
| PORTAGE | 9,642 | 851 (9) | 6 | 163 | 157 (96) |
| PREBLE | 2,807 | 221 (8) | 4 | 47 | 43 (91) |
| PUTNAM | 2,587 | 97 (4) | 0 | 44 | 44 (100) |
| RICHLAND | 8,155 | 1,549 (19) | 44 | 220 | 176 (80) |
| ROSS | 4,810 | 930 (19) | 12 | 113 | 101 (89) |
| SANDUSKY | 4,086 | 513 (13) | 9 | 92 | 83 (90) |
| SCIOTO | 4,838 | 555 (11) | 11 | 160 | 149 (93) |
| SENECA | 3,649 | 318 (9) | 7 | 90 | 83 (92) |
| SHELBY | 3,727 | 469 (13) | 1 | 64 | 63 (98) |
| STARK (Canton) |
23,827 | 3,365 (14) | 64 | 594 | 530 (89) |
| SUMMIT (Akron) |
36,444 | 7,545 (21) | 160 | 887 | 727 (82) |
| TRUMBULL | 14,161 | 1,078 (8) | 24 | 384 | 360 (94) |
| TUSCARAWAS | 6,045 | 690 (11) | 12 | 146 | 134 (92) |
| UNION | 3,123 | 119 (4) | 0 | 39 | 39 (100) |
| VAN WERT | 1,949 | 200 (10) | 3 | 38 | 35 (92) |
| VINTON | 956 | 185 (19) | 0 | 24 | 24 (100) |
| WARREN | 12,275 | 507 (4) | 2 | 110 | 108 (98) |
| WASHINGTON | 3,800 | 490 (13) | 25 | 88 | 63 (72) |
| WAYNE | 7,950 | 1,004 (13) | 11 | 159 | 148 (93) |
| WILLIAMS | 2,506 | 431 (17) | 6 | 48 | 42 (88) |
| WOOD | 6,948 | 537 (8) | 2 | 105 | 103 (98) |
| WYANDOT | 1,534 | 237 (15) | 5 | 29 | 24 (83) |
| TOTAL | 760,212 | 110,306 (15) | 5,669 | 18,998 | 13,329 (70) |
ZIP Code Hot Spots
EWG identified 224 zip codes in 51 counties that contain neighborhoods where more than five percent of children under age six are lead poisoned based on the current 10 ug/dL standard.
Underlined zip codes also appear in the Ohio Department of Health list of High Risk Zip Codes requiring blood lead testing.
| County (City) |
ZIP Codes Containing High Risk Neighborhoods |
|---|---|
| ALLEN | 45801, 45804, 45805 |
| ASHTABULA | 44004 |
| ATHENS | 43730, 43766, 45732, 45764 |
| BELMONT | 43906, 43935 |
| BUTLER | 45011, 45013, 45015, 45042, 45044, 45056 |
| CLARK | 45502, 45503, 45504, 45505, 45506 |
| CLERMONT | 45106 |
| COLUMBIANA | 43920 |
| CUYAHOGA (Cleveland) |
44102, 44103, 44104, 44105, 44106, 44107, 44108, 44109, 44110, 44111, 44112, 44113, 44114, 44115, 44117, 44118, 44119, 44120, 44121, 44125, 44127, 44128, 44135, 44142, 44144 |
| ERIE | 44870 |
| FAIRFIELD | 43130 |
| FAYETTE | 43160 |
| FRANKLIN (Columbus) |
43081, 43201, 43202, 43203, 43204, 43205, 43206, 43207, 43209, 43210, 43211, 43215, 43219, 43222, 43223 |
| GEAUGA | 44021, 44062 |
| GREENE | 45385 |
| GUERNSEY | 43725 |
| HAMILTON (Cincinnati) |
45030, 45202, 45203, 45204, 45205, 45206, 45207, 45208, 45210, 45211, 45212, 45214, 45215, 45216, 45217, 45219, 45220, 45221, 45223, 45224, 45225, 45226, 45229, 45230, 45232, 45233, 45237, 45238 |
| HANCOCK | 45840 |
| HARRISON | 43907, 43950 |
| HIGHLAND | 45133 |
| HOCKING | 43138 |
| HURON | 44890 |
| JEFFERSON | 43903, 43908, 43938, 43952, 43953, 43964 |
| LAKE | 44077, 44095 |
| LAWRENCE | 45638 |
| LICKING | 43055, 43056 |
| LORAIN | 44035, 44052, 44054, 44055 |
| LUCAS (Toledo) |
43602, 43604, 43605, 43606, 43607, 43608, 43609, 43610, 43611, 43612, 43614, 43616, 43620, 43624 |
| MAHONING (Youngstown) |
44405, 44420, 44425, 44436, 44471, 44502, 44503, 44504, 44505, 44506, 44507, 44509, 44510, 44511, 44512, 44514, 44601 |
| MARION | 43302 |
| MEIGS | 45760, 45769, 45771 |
| MERCER | 45822 |
| MIAMI | 45356, 45373 |
| MONTGOMERY (Dayton) |
45402, 45403, 45404, 45405, 45406, 45407, 45408, 45409, 45410, 45414, 45417, 45418, 45427, 45431, 45439 |
| MORGAN | 43756, 43758 |
| MUSKINGUM | 43701 |
| PICKAWAY | 43113 |
| PIKE | 45661, 45690 |
| PORTAGE | 44240, 44243 |
| RICHLAND | 44902, 44903, 44905, 44906 |
| ROSS | 45601 |
| SANDUSKY | 43420 |
| SCIOTO | 45662 |
| SENECA | 44830, 44883 |
| SHELBY | 45365 |
| STARK (Canton) |
44601, 44646, 44647, 44702, 44703, 44704, 44705, 44706, 44707, 44714 |
| SUMMIT (Akron) |
44203, 44301, 44302, 44303, 44304, 44305, 44306, 44307, 44308, 44310, 44311, 44314, 44320 |
| TRUMBULL | 44446, 44481, 44483, 44484, 44485 |
| TUSCARAWAS | 43832, 44621, 44622, 44663, 44683 |
| WASHINGTON | 45750 |
| WAYNE | 44691 |
HMOs get paid for tests not done
Nearly half (48 percent) of children under age six in Ohio are eligible for Medicaid. The state of Ohio pays six managed care plans, commonly known as HMOs, to provide Medicaid services to families in fifteen counties. HMOs currently servicing Medicaid recipients in Ohio include Buckeye Community Health Plan, CareSource, MediPlan, Paramount, QualChoice and SummaCare (OHPb 2004). Data compiled by the Ohio Department of Job and Family Services shows that Medicaid-contracting HMOs failed to test 64% of one-year-old and 79% of two-year-old Medicaid-enrolled children (OHP 2003). EWG's analysis of state lead poisoning rates shows that through this failure to test, HMOs did not identify at least 5,300 lead-poisoned children across the state. The failure to test Medicaid children for lead poisoning is a clear violation of federal and state law.
LINK: HMO Contract with lead testing requirement (PDF file)
Ohio HMOs Conducted Less than One Third of the Lead Tests For Which They Were PaidData for 2 Year-Olds in 2000, 2001, and 2002 View Data and Further Details |
A young child who receives Medicaid is three times more likely to have elevated levels of lead in their blood than a young child who is not enrolled in Medicaid (CDC 2000). Children enrolled in Medicaid account for 60% of children found with elevated blood lead levels of concern, those greater than 10 µg/dL, and 83% of children with elevated blood lead levels greater than 20 mg/dL (CDC 2000). Screening this vulnerable population is vital to identifying and treating those suffering from this childhood epidemic.
Federal and state Medicaid law mandates universal screening for all children who are enrolled in Medicaid programs at 12 and 24 months, and up to 6 years of age. The Medicaid Act, administered by the federal government, provides financial assistance to states in order to furnish medial care to individuals who lack the financial means to obtain necessary health care (42 U.S.C. § 1396). Participation in the Medicaid program is voluntary, but state Medicaid medical care providers must comply with the requirements imposed by the Act and its accompanying regulations (42 U.S.C. at 1396a, Wilder, et al. v. Virginia Hosp. Ass'n, 496 U.S. 498, 502 (1990)). The Medicaid Act dictates that providers conduct a comprehensive battery of screening services known as early and periodic screening, diagnostic, and treatment services or EPSDT, which include a "blood lead level assessment" (42 U.S.C. § 1396d(r)). The implementing regulations also require medical care providers to inform all eligible recipients of the availability of screening, offer transportation, and provide scheduling assistance to facilitate delivery of the screening services (42 C.F.R. § 441.56).
The Centers for Medicare and Medicaid Services, or CMS, the division of Health and Human Services responsible for administering Medicaid, publishes the State Medicaid Manual, which provides authoritative guidance for the delivery of EPSDT screening services. The Manual dictates that universal blood lead screening is mandatory at ages 12 and 24 months, and up to 6 years of age for all Medicaid recipients:
Lead Toxicity Screening. — All children are considered at risk and must be screened for lead poisoning. [CMS] requires that all children receive a screening blood lead test at 12 months and 24 months of age. Children between the ages of 36 months and 72 months of age must receive a screening blood lead test if they have not been previously screened for lead poisoning.
(State Medicaid Manual § 5123.2(D)(1)).
The State of Ohio has incorporated federal Medicaid standards in full, and has developed a program called Healthchek, which is "the early and periodic screening, diagnosis, and treatment program, a component of the medical assistance program under ... the 'Social Security Act'" (Ohio Rev. Code Ann. § 3313.714). Ohio's state Medicaid Program also mandates universal screening:
[a]ll children are at risk for lead poisoning and must be screened ... at twelve months and twenty-four months of age ... [c]hildren between the ages of thirty-six months and seventy-two moths of age must receive a screening lead blood test if they have not been previously screened for lead poisoning.
(OAC § 5101:3-14-03(H)).
Ohio contracts with managed care providers, the legal term for Health Maintenance Organizations or HMO's, to "provide ... health care services to medical assistance recipients" (Ohio Rev. Code Ann. § 5111.17(B)). As such, Medicaid contracting HMO's are required to "provide all early and periodic screening, diagnosis, and treatment (EPSDT) services, also known as healthchek services" (OAC 5101:3-26-03(I)(9)). According to the contract between Ohio HMO's for the delivery of Medicaid services, HMO's "must ensure that members have access to medically necessary services ... including Early Periodic Screening, Diagnosis, and Treatment (EPSDT/HealthChek)" (ODJFS 2004-05). The contract incorporates new lead screening-specific goals effective as of 2005. The new provisions set a minimum performance standard of a 10% improvement towards a goal of an 80% screening rate overall. The contract also provides for notification of noncompliance as well as plans for improvement, supervised by Ohio's Department of Jobs and Family Services.
Ohio HMOs are paid a lump sum fee, in advance, for delivery of Medicaid services. This lump sum, called a "capitated" payment, is calculated based on the estimated cost of covered services and the number of enrollees (Mercer 2003). The system is intended to facilitate treatment and limit the potential for defrauding the state through overbilling. Despite this intent, researchers at the Government Accounting Office found that the system creates "an incentive to underserve or even deny beneficiaries access to needed care since plans ... can profit from not delivering services" (GAO 1997).
This incentive is particularly powerful where a "bundle" of services, such as the battery of tests that the blood lead screening falls under, the EPSDT, is involved. The HMO can receive payment for providing a series of tests, and when it fails to provide the test, it can add the savings to its profits. With the cost of a blood lead lab test at approximately $60.00 per test, and approximately 141,000 one and two year-olds on Medicaid in Ohio (ODJFS 2003), this could amount to a profit of $8.5 million per year. Some 47,000 Medicaid-eligible children are born in Ohio each year (OHPa 2004). Considering this profit incentive not to screen, it is not surprising that in Ohio, the blood lead screening rate for one and two year-olds has yet to exceed 40% despite the requirement for HMOs to screen 100% of these children.
HMOs have already begun to face potential legal liability for their failure to screen children enrolled in Medicaid. In Ohio, a parent of a lead poisoned child sued an Ohio Medicaid HMO, QualChoice health plan, for failure to provide lead screening to her son, who was first diagnosed with lead poisoning at 26 months of age (Moran 2000). In Missouri, the Attorney General filed suit against two HMOs alleging breach of contract for failure to screen children for lead poisoning that was guaranteed by Medicaid. One suit settled for $1.1 million, the other case is pending (Missouri ex rel. Nixon v. Prudential Health Care Plan, Inc.).
References
Centers for Disease Control and Prevention, Recommendations for Blood Lead Screening of Young Children Enrolled in Medicaid: Targeting a Group at High Risk, December 8, 2000, at p. 3.
General Accounting Office (GAO), Medicaid Managed Care: Challenge of Holding Plans Accountable Requires Greater State Effort, HEHS-97-86, May 1997.
Mercer Government Human Services Consulting, July 1, 2003-December 31, 2004 Capitation Rate Final Certification, November 11, 2003.
Office of Ohio Health Plans (OHP), Bureau of Managed Health Care, Ohio Medicaid Managed Health Care Clinical Performance Measures State Fiscal Year 2002, May 2003.
Office of Ohio Health Plans (OHPb), Bureau of Managed Health Care, Managed Care Plan Membership, April 1, 2004.
Office of Ohio Health Plans (OHPa), Ohio Medicaid Report January 2004 Update, January 2004.
Ohio Department of Jobs and Family Services (ODJFS) Medicaid-Contracting Managed Care Plans Provider Agreement State Fiscal Year 2004-2005 at Appendix G.
Ohio Department of Jobs and Family Services (ODJFS) Performance Center Management Meeting, Lead Screening Rates for Children Ages One and Two, May 29, 2003.
Mark Moran, Parent Sues HMO in Lead Poisoning Case, WebMD Medical News, Aug. 10, 2000.
State Designated High Risk ZIP Codes
Listed below are high risk zip codes identified by the state of Ohio. Under a new state law that went into effect April 1, 2004, all children in these zip codes ages one and two must be tested for blood lead.
Underlined zip codes also appear in EWG's list of Zip Code Hot Spots that contain neighborhoods where more than five percent of children under age six are lead poisoned based on the current 10 ug/dL standard.
| County (City) |
High Risk Zip Codes |
|---|---|
| ALLEN | 45801, 45804, 45805, 45807 |
| ASHLAND | 44805, 44903 |
| ASHTABULA | 44004, 44030, 44062 |
| ATHENS | 45701, 45732, 45740, 45782 |
| BELMONT | 43901, 43912, 43917, 43943 |
| BROWN | 45133 |
| BUTLER | 45011, 45013, 45014, 45015, 45044, 45056, 45069, 45246, 45327 |
| CHAMPAIGN | 43078, 45365, 45502 |
| CLARK | 43078, 43140, 43153, 45316, 45324, 45387, 45502, 45503, 45504, 45505, 45506 |
| CLINTON | 45177 |
| COLUMBIANA | 43920, 43968, 44413, 44601 |
| COSHOCTON | 43812 |
| CRAWFORD | 43302, 44818, 44820, 44825, 44827, 44833, 44854, 44875, 44887 |
| CUYAHOGA (Cleveland) |
44102, 44103, 44104, 44105, 44106, 44107, 44108, 44109, 44110, 44111, 44112, 44113, 44114, 44115, 44117, 44118, 44119, 44120, 44121, 44122, 44123, 44126, 44127, 44128, 44135, 44144, 44146 |
| DARKE | 45308, 45318, 45331, 45337, 45348, 45351, 45362, 45380, 45382, 45388, 45390 |
| DELAWARE | 43015 |
| ERIE | 44811, 44870 |
| FAIRFIELD | 43113, 43130 |
| FAYETTE | 43143, 43145, 43153, 45123 |
| FRANKLIN (Columbus) |
43085, 43125, 43140, 43201, 43202, 43203, 43204, 43205, 43206, 43207, 43209, 43210, 43211, 43212, 43213, 43214, 43215, 43217, 43219, 43221, 43222, 43223, 43224, 43227, 43228, 43230, 43231, 43232 |
| FULTON | 43502, 43521, 43567 |
| GEAUGA | 44021, 44062, 44231, 44491 |
| GREENE | 43153, 45314, 45316, 45324, 45387, 45424, 45431, 45432, 45433 |
| GUERNSEY | 43725 |
| HAMILTON (Cincinnati) |
45202, 45203, 45204, 45205, 45206, 45207, 45208, 45209, 45210, 45211, 45212, 45213, 45214, 45215, 45216, 45217, 45218, 45219, 45220, 45223, 45224, 45225, 45226, 45227, 45229, 45231, 45232, 45236, 45237, 45238, 45242, 45246 |
| HANCOCK | 43516, 44316, 44830, 45840, 45843, 45872 |
| HARDIN | 43345, 43347, 45843 |
| HARRISON | 43901, 44683 |
| HENRY | 43502, 43511, 43567 |
| HIGHLAND | 45123, 45133 |
| HOCKING | 45732 |
| HOLMES | 44627 |
| HURON | 44807, 44811 |
| JACKSON | 45601 |
| JEFFERSON | 43901, 43917, 43943, 43952 |
| LAKE | 44077 |
| LICKING | 43055 |
| LOGAN | 43311, 43345, 43347, 43358 |
| LORAIN | 44028, 44035, 44044, 44052, 44055 |
| LUCAS (Toledo) |
43602, 43604, 43605, 43606, 43607, 43608, 43609, 43610, 43611, 43612, 43613, 43614, 43615, 43616, 43620, 43624 |
| MADISON | 43140, 43143, 43151, 43153 |
| MAHONING (Youngstown) |
44405, 44436, 44471, 44481, 44502, 44503, 44504, 44505, 44507, 44510, 44511, 44512, 44601 |
| MARION | 43323, 44302, 44833 |
| MEDINA | 44203 |
| MEIGS | 45760, 45769 |
| MERCER | 45388 |
| MIAMI | 45308, 45318, 45337, 45339, 45356, 45359, 45373, 45424 |
| MONTGOMERY (Dayton) |
45327, 45345, 45402, 45403, 45404, 45405, 45406, 45407, 45408, 45409, 45410, 45414, 45417, 45418, 45419, 45420, 45424, 45426, 45427, 45431, 45432 |
| MORGAN | 45732 |
| MORROW | 44833, 44903 |
| MUSKINGUM | 43701, 43812 |
| OTTAWA | 43420 |
| PICKAWAY | 43113, 43115, 43125, 43143, 43145, 43164 |
| PIKE | 45133, 45601 |
| PORTAGE | 44231, 44240, 44266 |
| PREBLE | 45321, 45327, 45382 |
| RICHLAND | 44805, 44827, 44833, 44875, 44902, 44903, 44905, 44906, 44907 |
| ROSS | 43115, 43164, 45601 |
| SANDUSKY | 43420, 43431, 43435, 44811 |
| SCIOTO | 45662 |
| SENECA | 43316, 44807, 44811, 44818, 44830, 44854, 44883 |
| SHELBY | 45356, 45365, 45380, 45388 |
| STARK (Canton) |
44601, 44646, 44647, 44662, 44702, 44703, 44704, 44705, 44706, 44707, 44708, 44709, 44710, 44714 |
| SUMMIT (Akron) |
44203, 44221, 44223, 44240, 44301, 44302, 44303, 44304, 44305, 44306, 44307, 44308, 44310, 44311, 44313, 44314, 44320, 44321, 44322 |
| TRUMBULL | 44062, 44420, 44446, 44481, 44483, 44484, 44485, 44491, 44504, 44505 |
| TUSCARAWAS | 44622, 44683 |
| UNION | 43015, 43302, 43358 |
| VAN WERT | 45891 |
| WARREN | 45036, 45044 |
| WASHINGTON | 45750 |
| WAYNE | 44606, 44627, 44662, 44667, 44691 |
| WILLIAMS | 43502, 43521, 43543, 43554 |
| WOOD | 43402, 43413, 43460, 43511, 43516, 43551, 43605, 44830, 45872 |
| WYANDOT | 43316, 43323, 43351, 43359, 45843 |
Medicaid Children Not Tested
In many Ohio counties, less than ten percent of one- and two-year-olds on Medicaid are tested for blood lead.
| County (City) |
Medicaid Eligable One and Two Year Olds | Not Screened for Lead (Percent) |
Estimated Medicaid Children Lead Poisoned but Not Identified |
|---|---|---|---|
| ADAMS | 546 | 416 (76) | 20 |
| ALLEN | 1,492 | 1,228 (82) | 69 |
| ASHLAND | 511 | 420 (82) | 25 |
| ASHTABULA | 1,472 | 1,254 (85) | 78 |
| ATHENS | 806 | 527 (65) | 29 |
| AUGLAIZE | 376 | 331 (88) | 20 |
| BELMONT | 926 | 620 (67) | 40 |
| BROWN | 578 | 412 (71) | 20 |
| BUTLER | 3,370 | 2,891 (86) | 130 |
| CARROLL | 326 | 282 (87) | 16 |
| CHAMPAIGN | 426 | 294 (69) | 17 |
| CLARK | 2,180 | 1,179 (54) | 67 |
| CLERMONT | 1,826 | 1,349 (74) | 53 |
| CLINTON | 470 | 380 (81) | 21 |
| COLUMBIANA | 1,505 | 1,135 (75) | 70 |
| COSHOCTON | 466 | 328 (70) | 19 |
| CRAWFORD | 676 | 556 (82) | 36 |
| CUYAHOGA (Cleveland) |
20,979 | 11,704 (56) | 718 |
| DARKE | 465 | 337 (72) | 22 |
| DEFIANCE | 462 | 340 (74) | 19 |
| DELAWARE | 627 | 532 (85) | 22 |
| ERIE | 797 | 711 (89) | 39 |
| FAIRFIELD | 1,119 | 878 (78) | 44 |
| FAYETTE | 410 | 327 (80) | 18 |
| FRANKLIN (Columbus) |
15,385 | 10,015 (65) | 442 |
| FULTON | 377 | 330 (88) | 21 |
| GALLIA | 614 | 418 (68) | 20 |
| GEAUGA | 327 | 298 (91) | 13 |
| GREENE | 1,326 | 1,122 (85) | 47 |
| GUERNSEY | 703 | 472 (67) | 27 |
| HAMILTON (Cincinnati) |
10,560 | 7,419 (70) | 426 |
| HANCOCK | 652 | 604 (93) | 33 |
| HARDIN | 375 | 328 (87) | 21 |
| HARRISON | 230 | 175 (76) | 12 |
| HENRY | 267 | 212 (79) | 14 |
| HIGHLAND | 669 | 537 (80) | 28 |
| HOCKING | 465 | 387 (83) | 20 |
| HOLMES | 251 | 221 (88) | 12 |
| HURON | 839 | 669 (80) | 41 |
| JACKSON | 596 | 432 (72) | 23 |
| JEFFERSON | 979 | 808 (83) | 48 |
| KNOX | 627 | 547 (87) | 32 |
| LAKE | 1,434 | 1,134 (79) | 49 |
| LAWRENCE | 1,260 | 987 (78) | 47 |
| LICKING | 1,580 | 1,219 (77) | 61 |
| LOGAN | 576 | 480 (83) | 28 |
| LORAIN | 3,515 | 2,342 (67) | 116 |
| LUCAS (Toledo) |
6,860 | 4,604 (67) | 268 |
| MADISON | 368 | 282 (77) | 15 |
| MAHONING (Youngstown) |
3,503 | 2,165 (62) | 119 |
| MARION | 812 | 606 (75) | 37 |
| MEDINA | 869 | 632 (73) | 28 |
| MEIGS | 431 | 276 (64) | 15 |
| MERCER | 331 | 318 (96) | 17 |
| MIAMI | 864 | 641 (74) | 36 |
| MONROE | 186 | 128 (69) | 7 |
| MONTGOMERY (Dayton) |
6,786 | 5,144 (76) | 254 |
| MORGAN | 261 | 187 (72) | 11 |
| MORROW | 373 | 322 (86) | 17 |
| MUSKINGUM | 1,408 | 774 (55) | 44 |
| NOBLE | 155 | 107 (69) | 6 |
| OTTAWA | 357 | 288 (81) | 15 |
| PAULDING | 219 | 186 (85) | 10 |
| PERRY | 560 | 438 (78) | 26 |
| PICKAWAY | 581 | 490 (84) | 26 |
| PIKE | 596 | 530 (89) | 23 |
| PORTAGE | 1,362 | 1,038 (76) | 48 |
| PREBLE | 372 | 280 (75) | 17 |
| PUTNAM | 255 | 228 (89) | 14 |
| RICHLAND | 1,705 | 1,250 (73) | 68 |
| ROSS | 1,102 | 875 (79) | 47 |
| SANDUSKY | 770 | 505 (66) | 33 |
| SCIOTO | 1,619 | 1,486 (92) | 84 |
| SENECA | 649 | 437 (67) | 30 |
| SHELBY | 509 | 394 (77) | 22 |
| STARK (Canton) |
4,635 | 3,506 (76) | 195 |
| SUMMIT (Akron) |
6,440 | 3,946 (61) | 214 |
| TRUMBULL | 2,975 | 2,526 (85) | 135 |
| TUSCARAWAS | 1,062 | 868 (82) | 54 |
| UNION | 351 | 324 (92) | 17 |
| VAN WERT | 288 | 239 (83) | 16 |
| VINTON | 297 | 213 (72) | 10 |
| WARREN | 859 | 646 (75) | 25 |
| WASHINGTON | 886 | 703 (79) | 37 |
| WAYNE | 986 | 708 (72) | 37 |
| WILLIAMS | 476 | 301 (63) | 18 |
| WOOD | 842 | 660 (78) | 33 |
| WYANDOT | 199 | 148 (74) | 10 |
| TOTAL | 140,577 | 98,986 (70%) | 5,331 |
Research shows greater risk to children
Although average levels of lead in the blood of America’s children have dropped dramatically in the last 20 years, lead paint remains a top environmental threat to children’s health. For young children, there is no known safe level of exposure to lead; even low levels can cause reduced IQ and attention span, learning disabilities, and a wide range of other health effects. Lead is most dangerous to children under six, whose brains and nervous systems are still developing and whose outdoor activities and tendency to put things in their mouths can expose them to a disproportionate amount of lead in soil, paint and dust.
CDC estimates that nationwide, about 2.2 percent of children ages 1 through 5 have harmful levels of lead in their blood (CDC 2003). But national averages mask the severity of the problem in many communities. CDC’s testing shows that children from poor families are eight times more likely to be lead poisoned than children from higher-income families. Nationally, non-Hispanic Black children are five times more likely, and Mexican-Americans almost twice as likely, to be poisoned than non-Hispanic White children (CDC 1997).
A growing body of science indicates that levels of lead thought to be safe by government health officials are, in fact, quite hazardous. Research results published in the New England Journal of Medicine in April, 2003 showed an average IQ decline of 7.4 points for children with blood lead levels currently deemed safe — 10 micrograms of lead per deciliter of blood (10 µg/dL) — when compared to children with blood lead levels less than 1 (Canfield et al. 2003). The estimate in EWG’s investigation of 19,000 lead poisoned children in Ohio considers only children with blood lead over 10 µg/dL. If the effects of lead poisoning at lower levels were included, thousands of additional children across Ohio could be affected.
The state’s failure to identify the overwhelming majority of children with dangerous levels of lead in their blood hampers the development of an effective statewide program to reduce lead poisoning. As a result, despite significant advances in the diagnosis and prevention of lead poisoning, a generation of high-risk Ohio children have suffered needlessly.
This tragedy is intolerable, not only for its effect on public health but on other areas of public policy. Continuing to allow thousands of children to suffer from lead poisoning has serious consequences for the future of Ohio’s schools, health care, economy and criminal justice system. The state could make no better investment than fully funding and enforcing the testing requirements in the new state lead law, HB 248, which took effect on April 1, 2004, and mandates testing for children in state-designated high-risk ZIP codes.
A slow poisoning
There is no disagreement about the adverse health effects of lead. It is a highly toxic heavy metal that can cause permanent neurological and behavioral problems and affects virtually every system in the body (CDC 1991). Young children are particularly susceptible to the effects of lead because they explore their world with hands and mouth, increasing the chances for ingestion. In addition, a child or fetus absorbs up to four times more lead than an adult (DHS 1998a). Adults typically absorb 10 to 15 percent of ingested lead, but for children and pregnant women, it's as high as 50 percent (Royce and Needleman 1985).
Lead is a widely acknowledged developmental and reproductive toxin because of its potential for causing infertility and spontaneous abortion in adults and developmental defects in children. Some studies also suggest a relationship between rising blood lead levels and pre-term delivery, low birth weight and fetal growth retardation (Schettler et al 1998). Lead can affect children at extremely low levels, and there is no evidence of a threshold dose below which developmental effects do not occur. Levels as low as 10 micrograms per deciliter of blood (µg/dL) — currently considered the threshold for elevated blood lead level — have been associated with decreased intelligence and impaired neurobehavioral development (CDC 1994). Consumption of as little as 10 micrograms — one-millionth of a gram, which is 1/28 of an ounce — of lead a day can poison a child.
Since lead has been removed from gasoline and food containers, its most common source is lead-based house paint. About 10 billion pounds of lead paint were used in the United States between its introduction in 1889 and the imposition of federal restrictions in 1970 — 61 years after France, 48 years after Australia and 44 years after Great Britain. House dust is often contaminated by lead-based paint that is peeling or deteriorating, or is disturbed during renovation or the preparation of painted surfaces for repainting without proper safeguards. Soil contamination can be traced to deteriorating exterior paint or the past widespread use of leaded gasoline.
Lead was a major ingredient in most interior and exterior oil house paint before 1950 and was still used in some paints until 1978, when the residential use of lead paint was banned. Other sources of lead in a child's environment include lead-contaminated drinking water, lead-contaminated soil, imported ceramic tableware with lead glaze, old and imported toys or furniture painted with lead-based paint, the clothing of parents whose work or hobby involves high levels of lead, and even home remedies used by some ethnic groups. In Ohio, state officials estimate that about one-sixth of lead-poisoned children were exposed through “contact with ethnically associated products such as home remedies, cosmetics, ceramic pottery, cookware and food” (DHS 1999).
Lead Poisoning in Communities of Color
Communities of color and low-income communities bear a much greater burden of lead poisoning. In 1997, the CDC's National Health and Nutrition Examination Survey (NHANES) found that while one to two percent of middle- and high- income children in the U.S. have lead poisoning, 8 percent of low-income children do. On average, low-income children have blood lead levels twice that of high-income children — 3.8 µg/dL vs. 1.9 µg/dL. Similarly, 11.2 percent of non-Hispanic Black children and 4 percent of Mexican-American children nationwide have lead poisoning, compared to 2.3 percent of Non-Hispanic White children (The CDC's national figures do not account for Latinos of other ancestries.) (CDC 1997).
There are no overt symptoms of lead poisoning. The only way to identify and treat lead poisoned children is through early and periodic testing, diagnosis and treatment. In 1991, the CDC recommended that all young children get blood lead tests. At that time, one in six children in the U.S., and as many as 67 percent of black inner-city children, had lead poisoning high enough to cause significant impairment to their neurological development (NAACP 1991).
References
Canfield, R.L., Henderson, C.R., et. al. 2003. "Intellectual Impairment in Children with Blood Lead Concentrations below 10 µg per Decileter." New England Journal of Medicine 348(16): 1517-1526. April 17, 2003.
Centers for Disease Control and Prevention (CDC). 1991. "Preventing Lead Poisoning in Young Children: A statement by the Centers for Disease Control and Prevention." US Dept. of Health and Human Services, Public Health Service, Centers for Disease Control and Prevention. http://www.cdc.gov/nceh/pubcatns/1994/cdc/books/plpsn/plpsn0-3.htm
Centers for Disease Control and Prevention (CDC). 1994. "Data to Action: CDCÕs Public Health Surveillance for Woman, Infants and Children, Maternal and Child Health Monograph." United States Centers for Disease Control, Washington, DC. http://www.cdc.gov/nccdphp/drh/datoact/
Centers for Disease Control and Prevention (CDC). 1997. "Update: Blood Lead Levels - United States 1991-1994." Morbidity and Mortality Weekly Report 46(07): 141-146.
Centers for Disease Control and Prevention (CDC). 2003. "Surveillance for Elevated Blood Lead Levels Among Children - United States, 1997 - 2001." Morbidity and Mortality Weekly Report 52(SS-10) September 12, 2003.
Department of Health Services (DHS). 1998A. Lead Hazards in California's Public Elementary Schools and Child Care Facilities. Department of Health Services, Childhood Lead Poisoning Prevention Branch, Emeryville, CA citing Jacobs, DE. 1995. "Lead-based Paint As A Major Source of Childhood Lead Poisoning: A Review of the Evidence," In, Lead in Paint, Soil and Dust: Health Risks, Exposure Studies, Control Measures and Quality Assurance. ASTM STP 1226. Ed. M E Beard SC Allen Iske. Philadelphia, ASTM.
Department of Health Services (DHS). 1999. Attachment 1. "Summary of the [Science and Policy Advisory Panel] Recommendations [on screening]." In, grant proposal submitted by the Department of Health Services and the Public Health Institute to the Centers for Disease Control and Prevention March 31, 1999.
NAACP. 1991. "Stipulated Voluntary Dismissal." Filed in the U.S. District Court of California, San Francisco, Nov 1. CIV No. C-90-3620 EFL.
Royce, S. and H. Needleman, eds. 1985. "Case Studies in Environmental Medicine: Lead Toxicity." Agency for Toxic Substances and Disease Registry.
Schettler, T et al. 1998. "Generations at Risk: How Environmental Toxicants May Affect Reproductive Health In California." CALPIRG and PSR citing Agency for Toxic Substances and Disease Registry. Toxicological Profile for Lead. Atlanta, GA: US Dept. of Health and Human Services, ATSDR, April, 1993 and McMichael, A et al. 1986. "The Port Pirie Study: Maternal Blood Lead and Pregnancy Outcome." J Epi Comm Health 40:18-25.
Office of Ohio Health Plans (OHP), Ohio Medicaid Report, January 2004.
Bush Admin. stymies added protections
The Bush administration's proposed 2005 budget cuts $35 million from the Department of Housing and Urban Development (HUD)'s lead poisoning prevention program, a 20 percent reduction from the previous year. The program pays for expert home evaluations and repairs to prevent young children from being exposed to lead-contaminated dust, soil and paint chips (Washington Post 2004). Primary prevention is the key to ending future lead poisoning and the related personal and social costs. Cuts to this program serve only to perpetuate unnecessary lead poisoning of future generations.
This is not the first time that the Bush administration has hindered lead poisoning prevention efforts. In 2002, in a move that catered to the interests of the lead industry, the Bush Administration shuffled the appointments to the Centers for Disease Control and Prevention's (CDC) Advisory Committee on Childhood Lead Poisoning Prevention, replacing reputable public health and pediatric lead experts with panelists with a history of defending the lead industry in the courts.
The Committee's charge is to assess scientific data on lead and recommend changes to CDC policy to prevent childhood lead poisoning. The Committee also advises CDC on its blood lead level limit standard for children. In the summer of 2002, just weeks before the Committee was due to begin its latest review of scientific data to determine if a revision of the federal lead-poisoning standard was necessary, the Bush Administration stepped in, drastically changing the composition of the Committee.
Anticipating that the current committee would likely rule in favor of lowering the level of concern for elevated blood lead, Tommy Thompson, secretary of the Department of Health and Human Services (HHS), removed respected pediatric lead experts from the panel, and rejected the nominations of scientists with established expertise in the health effects associated with childhood lead poisoning. Newly vacant seats were then filled by individuals with direct ties to the lead industry, clear financial conflicts of interest, and limited expertise on the issue of childhood lead poisoning. The resulting shift in the composition of the panel contributed to the CDC's recommendation not to lower the level of concern for elevations of blood lead below 10 µg/dL, even as the Center acknowledged research that has confirmed serious, permanent cognitive and academic defects at blood lead levels below 10 µg/dL (CDC CLPPP 2004).
Below is an overview of the panel changes that replaced childhood lead poisoning experts with lead industry-connected scientists:
Nominated Advisors with Conflicts of Interest
- Dr. William Banner, expert witness for the lead industry who stated that lead is harmful only at levels that are 7-10 times as high as the current CDC blood lead levels of concern. Testified on behalf of lead companies in lead poisoning-related litigation (The Nation 2004, Markey 2002a, Markey et al. 2002b). During the course of a deposition in this litigation, Banner testified as follows:
Q. (Attorney for State of Rhode Island) "I'm asking you for your expert opinion in this case. Do you believe that any of the epidemiological studies have established any relationship between lead ingestion and adverse cognitive, behavioral, or emotional status?
A. (Dr. William Banner) "No." (Markey 2002c). - Dr. Joyce Tsuji, principal scientist for Exponent, 31% of whose clients have a financial interest in the deliberations of the CDC Advisory Committee on Childhood Lead Poisoning Prevention. (Markey 2002c). Exponent's corporate clients include ASARCO, which is currently disputing EPA's assumptions that ASARCO is the source of elevated lead and arsenic in residential soils in El Paso and fighting Superfund designation, and King and Spalding, a DC law firm representing several large lead firms (Markey 2002c).
- Dr. Kimberly Thompson, Assistant Professor of Risk Analysis and Decision Science, Harvard School of Public Health, affiliated with the heavily industry-funded Harvard Center for Risk Analysis. HCRA has over 20 corporate funders with a financial interest in the deliberations of the CDC Advisory Committee on Childhood Lead Poisoning Prevention and less stringent lead regulations. Three of these funders have Superfund sites with lead contamination Ð Monsanto, FMC Corporation and Ciba-Geigy Corporation (Markey 2002c).
- Dr. Sergio Piomelli, Professor, Columbia Presbyterian Medical Center, researcher who reportedly criticized the CDC Lead Advisory Committee when it decided to lower the elevated blood lead level of concern from 25 ug/dL to 10 ug/dL. Reports indicate that Piomelli and another appointee, William Banner, were first contacted about serving on the committee by lead industry representatives (The Nation 2004).
Childhood Lead Poisoning Experts Removed from the Panel or Whose Nominations Were Rejected
Removed from Panel:
- Dr. Michael Weitzman, Department of Pediatrics, University of Rochester, and Pediatrician in Chief, Rochester General Hospital, member of the panel since 1997 and the author of numerous peer-reviewed publications on lead poisoning (Markey 2002a). Shortly before Secretary Thompson rejected his reappointment, Weitzman was told by CDC staff that they planned to nominate him to chair the committee (UCS 2004).
Nomination Rejected:
- Dr. Bruce Lanphear, Associate Professor, Department of Pediatrics, University of Cincinnati, Ohio, currently the Sloan Professor of Children's Environmental Health, conducted epidemiological studies of lead-contaminated house dust and residential soil, and studies confirming severe adverse cognitive and academic effects associated with blood lead levels below 10 mg/dL (Markey 2002a).
- Dr. Susan Klitzman, Associate Professor of Urban Public Health at the Hunter College School of Health Services, author of numerous peer-reviewed publications on lead poisoning (Markey 2002a).
The compromise in the integrity of the lead advisory committee is just one example in a series of industry-biased scientific appointments made by the current administration. The Federal Advisory Committee Act, 5 U.S.C. App. 1, mandates that scientific committees "not be inappropriately influenced by the appointing authority or by any special interest, but will instead be the result of the advisory committee's independent judgment." Despite this mandate, the Bush Administration has faced a firestorm of criticism for stacking scientific panels and advisory boards with industry-biased appointments. On February 18, 2004, over 60 leading scientists - including over 20 Nobel laureates, leading medical experts, former federal agency directors, and university chairs and presidents - released a letter voicing their concern over the "misuse of science by the Bush administration" (UCS 2004a). The letter states that the administration had disbanded scientific advisory committees, placed unqualified appointees on panels, censored reports that presented scientific conclusions that conflicted with administration positions, and abandoned the pursuit of scientific advice (UCS 2004a).
In an editorial in Science magazine, a publication of the American Association for the Advancement of Science, this trend was referred to as an "epidemic," in which scientific committees "are shut down and reassembled with new members, and candidates are subjected to loyalty tests," rather than being judged based on objective criteria such as training, ability and performance (Science 2003). In November 2002, the American Public Health Association (APHA) released an official policy statement objecting to "recent steps by government officials at the federal level to restructure key federal scientific and public health advisory committees by retiring the committees before their work is completed, removing or failing to reappoint qualified members, and replacing them with less scientifically qualified candidates and candidates with a clear conflict of interest," arguing that "such steps suggest an effort to inappropriately influence these committees" (APHA 2002).
In response to a September 2003 Office of Management and Budget proposed rule which would set up peer review panels to screen all use of science in drafting federal regulations, Representative Edward Markey, Senior Member of the Energy and Commerce Committee, issued a letter along with eight other Members of Congress, criticizing the administration for purportedly "stacking review panels with industry-funded scientists and asking them to review regulatory science for their own industries." Under the original version of the rule, the peer review panels would exclude scientific experts who receive grants from the federal agency performing the review, but would allow candidates who receive funds from industry, even those potentially affected by the regulations. An April 15, 2004 revision to the rule provided more authority to individual agencies in determining ethical and conflicts of interest standards for the peer review process.
Industry-Biased Scientific Panel Staffing Decisions:
- CDC's National Center for Environmental Health, which reviews research and makes suggestions on a range of public health policy issues, was completely gutted and replaced with industry-biased appointees, including Lois Swirsky Gold, who denies many of the links between pollutants and cancer, and Dennis Paustenbach, an expert witness who testified for Pacific Gas & Electric in the well-known Erin Brockovich court case involving the contaminant Chromium 6. Committee chair Dr. Thomas Burke learned that fifteen of the panel's eighteen members were going to be replaced, including him. "In the past, HHS had asked Burke for a list of recommendations; this time, it had its own list, and Burke was not on it" (The Nation 2004).
- Several members of Congress concerned about the integrity of science advisory committees issued a letter to Secretary Thompson questioning the propriety of the collaboration between chemical-industry association, the American Chemistry Council, and the National Institute of Environmental Health Sciences on a testing program of high production volume chemicals (Markey 2002b).
- The Office of Management and Budget, under the leadership of John Graham, head of Office of Information and Regulatory Affairs (OIRA), proposed to require agencies to subject to peer review "any scientific or technical study that is relevant to regulatory policies." Graham began his tenure with a much-criticized agency-wide memo in September 2001 urging staff to conduct a cost-benefit analysis of any proposed regulation of industry. Graham is former head of the industry-funded Harvard Center for Risk Analysis and many public statements prior to his appointment by President Bush. In a speech to the Heritage Foundation in 2000, Graham reportedly asserted that "[e]nvironmental regulation should be depicted as an incredible intervention in the operation of society" (Congressional Quarterly 2004).
References
American Public Health Association (APHA). (2002). "Ensuring the Scientific Credibility of Government Public Health Advisory Committees." Association News. Policy Statement LB02-2. Washington, DC. Accessed online April 22, 2004 at http://www.apha.org/legislative/policy/policysearch/
index.cfm?fuseaction=view&id=291.
Congressional Quarterly. 2004. "Dueling Science," March 20, 2004.
Markey, Rep. E.J. (2002a). "Lead Poisoning Advisory Panel Weighed Down by Lead Industry's Friends." October 8, 2002. Available online at: http://www.house.gov/markey/Issues/iss_environment_pr021008.pdf.
Markey, Rep. E.J., Pelosi, Rep. N., et al. (2002b). Letter to The Honorable Tommy G. Thompson, Secretary, Department of Health and Human Services. October 8, 2002. Available online at: http://www.house.gov/markey/Issues/iss_environment_ltr021008.pdf.
Markey, Rep. E.J. (2002c). "Turning Lead into Gold: How the Bush Administration is Poisoning the Lead Advisory Committee at the CDC." A report by the staff of Rep. Edward J. Markey. October 8, 2002. Available online at: http://www.house.gov/markey/Issues/iss_environment_rpt021008.pdf.
The Nation. (2004). "The New Scopes Trials," by Eric Alterman and Mark Green. February 27, 2004.
The New York Times. (2004). "At the Center of the Storm Over Bush And Science," by James Glanz. March 30, 2004.
Science. (2003). Editorial: "An Epidemic of Politics; Choice of Government Scientists Plagued by Political Bias," by Donald Kennedy. January 31, 2003.
The Washington Post. (2004). "Bush Budget Would Cut Lead Prevention Funds," by Avram Goldstein. April 11, 2004.
Union of Concerned Scientists (UCS). (2004). "Scientific Integrity in Policymaking: An investigation into the Bush Administration's Misuse of Science" by Seth Shulman. March 2004. Available online at: http://www.ucsusa.org/global_environment/rsi/page.cfm?pageID=1322.
Union of Concerned Scientists (UCS 2004a). Statement, Restoring Scientific Integrity in Policymaking. February 14, 2004.
CDC Childhood Lead Poisoning Prevention Program (CDC CLPPP), Frequently Asked Questions, "Why Not Change the Blood Lead Level of Concern at this Time?" http://www.cdc.gov/nceh/lead/spotLights/changeBLL.htm (last visited, April 23, 2004).
HMOs Failing to Conduct Tests
Data for 2 Year-Olds in 2000, 2001, and 2002:
Source: Ohio Medicaid Managed Health Care Clinical Performance Measures, State Fiscal Year 2002
| 2000 | 2001 | 2002 | |
|---|---|---|---|
| CareSource | 16.1% | 16.2% | 18.2% |
| Family Health Plan | 25.4% | 25.6% | 32.3% |
| Paramount | 12.3% | 10.3% | 14.2% |
| QualChoice | 21.9% | 18.1% | 32.3% |
| SummaCare | 12.2% | 11.9% | 17.2% |
| Statewide | 17.2% | 16.1% | 21.2% |
HMO Counties of Operation
| Plan | Counties |
|---|---|
| Buckeye Community Health Plan | Lucas |
| CareSource | Butler, Clark, Clermont, Cuyahoga, Franklin, Greene, Hamilton, Lorain, Montgomery, Pickaway, Stark, Summit, Warren |
| MediPlan | Stark |
| Paramount | Lucas, Wood |
| QualChoice | Cuyahoga |
| SummaCare | Summit |
Source: Managed Care Plan Membership, Medicaid Managed Health Care, The Ohio Department of Job and Family Services Bureau of Managed Health Care Program Development and Analysis Section, Report Prepared by Lisa Graupmann, April 1, 2004
Ohio's New Testing Law
In Ohio, only one in seven children under six years of age receives screening for blood lead poisoning. This is due to a lack of a requirement for screening the general population and a failure on the part of health care providers to comply with the federal mandate to test all children on Medicaid.
With the exception of children on Medicaid, no requirement existed for testing of children for lead poisoning in Ohio prior to April 1, 2004. In fact, if a child in Ohio was identified with a confirmed elevated blood level exceeding 10 µg/dL, the Ohio Department of Health (ODH) was not required to conduct any follow-up with the poisoned child. Ohio did have "recommendations" for screening and follow-up, but there was no firm requirement, and, in turn, no enforcement of these recommendations.
Under Ohio's recently adopted targeted screening law that went into effect on April 1, all medical care providers must conduct blood lead tests for children who live in "high risk" ZIP codes designated by ODH and for those who are likely to have exposure to lead. [1] Because Ohio has never conducted universal screening of children for lead poisoning, the ODH high-risk designation is not based on the actual prevalence of lead poisoning in the Ohio population. For those children who do not live in a targeted ZIP code, a verbal screen is required to determine a child's level of risk for exposure to lead. If a child or their parent/guardian answers yes to one of the following questions, a health care provider must conduct a lead screen:
- Does the child live in or regularly visit a home, child care facility or school built before 1950?
- Does the child live in or regularly visit a home, child care facility or school built before 1978 that has peeling, chipping, dusting, or chalking paint, or is being remodeled?
- Is the child exposed to an adult who has a lead-related hobby?
- Does the child have a sibling or playmate who has or did have lead poisoning?
(Ohio Administrative Code 3701-30-01)
All results of blood lead tests must be reported to the Ohio Department of Health, or ODH (OAC 3701-32-14). Once ODH is notified that a child under six has lead poisoning, or a confirmed level of blood lead at or above 10 µg/dL, ODH must identify the source of the lead poisoning (OAC 3701-30-07). If the source is a home, child-care facility, or school, ODH must conduct a risk assessment and order the property owner to control the existing lead hazards (OAC 3701-30-07, 3701-30-08, 3701-30-09). As of April 2004, the Ohio Childhood Lead Poisoning Prevention regulations require ODH issue guidance to medical care providers explaining the requirements for follow-up of blood lead screens (OAC 3701-30-03). [2]
Footnotes
[1] According to ODH guidelines which pre-date the new law, a high-risk zip code is an area which has at least 27% pre-1950 housing and at least 15% of the children under age five below poverty, or at least 12% of the children under age 3 with blood lead levels above 9 mg/dL (Ohio Childhood Lead Poisoning Prevention Program Medical Management Recommendations).
[2] As of the date of publication of this report, such guidance had not yet been produced.
References
Centers for Disease Control and Prevention, Recommendations for Blood Lead Screening of Young Children Enrolled in Medicaid: Targeting a Group at High Risk, December 8, 2000, at p. 3.
The Childhood Lead Poisoning Prevention Working Group (CLPP) Report to Ohio General Assembly, July 30, 2000 (amount adjusted for inflation).
Ohio Dept. of Jobs and Family Services (ODJFS) Medicaid-Contracting Managed Care Plans Provider Agreement State Fiscal Year 2004-2005 at Appendix G.
Ohio Department of Health, Childhood Lead Poisoning Report 2002.
Cost of Failing to Test
Ohio faces enormous avoidable costs due to the failure to identify and prevent childhood lead poisoning. The January 2004 passage of Ohio's new lead poisoning prevention law, for the first time, institutes a legal requirement to test high-risk children for lead poisoning. Identification, treatment and prevention of lead poisoning will save Ohio nearly a quarter of a billion dollars it would otherwise lose due to medical costs, compensatory education, and lost taxable income. In addition, the failure to prevent lead poisoning costs the state in follow-up care, juvenile detention and adjudication, and increased infant mortality and neonatal care.
Lead poisoning in children imposes costs associated with medical care, special education, juvenile delinquency adjudication and incarceration, and lost taxable income. Children with high blood lead levels are more likely to require speech therapy, special education, and even face incarceration due to violent criminal behavior (HUD 1999). Studies show that juvenile delinquents are five times more likely to have elevated levels of lead in their bones (Needleman 2002).
At approximately $60.00 each, providing a blood lead test to every child under the age of six in Ohio would cost $38 million each year. In contrast, if all of Ohio's estimated 19,000 children with elevated levels of lead in their blood had been identified, treated, and had their levels reduced by 5 µg/dL, the state could have saved $223 million in lost taxable income alone. [1] The annual cost per lead poisoned child to the state of Ohio is approximately $2100 in medical costs, including costs of physician visits, laboratory testing, chelation therapy, neuropsychological testing, and follow-up testing (CLPP 2000, NASA 2004). The annual cost for a lead poisoned child's special education is approximately $4600 (CLPP 2000, NASA 2004). Studies indicate that 20% of children with severely elevated blood lead levels require an average of three years of special education (Schwartz 1994). Thus, the prevention of the lead poisoning of the 949 children that Ohio reported as having severely elevated blood lead levels, above 20 µg/dL, represents an annual avoidable cost of $8.5 million in medical care and special education expenditures. This estimate only includes children actually tested and reported to the Ohio Department of Health, so the actual costs are even greater.
Footnotes
[1] Based on approximately $2350 lost in lifetime earnings for each 1mg/dL lead elevation in the blood (Grosse 2002).
References
The Childhood Lead Poisoning Prevention Working Group (CLPP) Report to Ohio General Assembly, July 30, 2000 (amount adjusted for inflation).
Department of Housing and Urban Development (HUD). 1999. Economic Analysis of the Final Rule on Lead-Based Point: Requirements for Notification, Evaluation and Reduction of Lead-Based Point Hazards in Federally-Owned Residential Property and Housing Receiving Federal Assistance. U.S. Department of Housing and Urban Development, September 7.
Grosse, S.D., et. al., Economic Gains Resulting from the Reduction in Children's Exposure to Lead in the United States, Environmental Health Perspectives, Vol. 10, No. 6, June 2002.
National Aeronatics and Space Administration (NASA), Gross Domestic Product Deflator Inflation Calculator, http://www.jsc.nasa.gov/bu2/inflateGDP.html (last visited April 27, 2004).
Needleman, H.L., et. al, Bone Lead Levels in Adjudicated Delinquents: A Case Control Study, Neurotoxicology and Teratology No. 24 711-717, 2002.
Schwartz, Joel, Societal Benefits of Reducing Lead Exposure, Environmental Research 66, p. 105-124, 1994.
Consumer Advice
Here are some ways to minimize lead poisoning hazards in the home:
Regularly Dust Areas Where Children Play. Mop floors and wipe window ledges and chewable surfaces such as cribs with a solution of powdered automatic dishwasher detergent in warm water. Dishwasher detergent is recommended due to its high phosphate content, most multi-purpose cleaners will not remove lead in ordinary dust. Wash toys and stuffed animals regularly. Make sure that children wash their hands before meals and before going to sleep.
Avoid Burning Painted Wood. Most homes built before 1960 contain heavily leaded paint, many homes built as recently as 1978 also contain lead paint. This paint could be on window frames, walls, the outside of homes, or other surfaces. Do not burn painted wood since it may contain lead.
Do Not Sand or Burn-off Paint That May Contain Lead. Lead paint in good condition is usually not a problem except in places where painted surfaces rub against each other and create dust (for example, opening a window). Sanding or burning off paint that may contain lead creates lead-contaminated dust and exposes you or your children to high doses of lead.
Hire A Professional to Remove Lead Paint. Scraping or sanding lead paint generates large amounts of lead dust,which causes lead poisoning. Consult your state health or housing department or your local lead poisoning prevention branch for suggestions on which private laboratories or public agencies may be able to help test your home for lead in paint. Hire a person with special training for correcting lead paint problems to remove lead-based paint. Vacate the building until all work and clean-up is complete. This is particularly important for children and pregnant women.
Avoid Bringing Lead Dust into The Home. If you work in construction, demolition, painting, with batteries, in a radiator repair shop or lead factory, or your hobby involves lead, you may unknowingly bring lead into your home on your hands or clothes. You may also be tracking in lead from soil around your home. Soil very close to homes may be contaminated from lead paint on the outside of the building or from lead-contaminated soil in which lead has settled from fumes from cars and trucks that used leaded gas. Use door mats to wipe your feet before entering the home. If you work with lead in your job or a hobby, change your clothes before you go home and wash these clothes separately. Encourage your children to play in sand and grassy areas instead of dirt, which sticks to fingers and toys. Try to keep your children from eating dirt, and make sure they wash their hands when they come inside.
Learn About Lead in Drinking Water. Most well and city water does not usually contain lead. Water usually picks up lead inside the home from household plumbing that is made with lead materials. The only way to know if there is lead in drinking water is to have it tested. Contact the local health department or the water supplier to find out how to get the water tested.
Eat right. A child who gets enough iron and calcium will absorb less lead. Foods rich in iron include eggs, red meats, and beans. Dairy products are high in calcium. Do not store food or liquid in lead crystal glassware or imported or old pottery. If you reuse old plastic bags to store or carry food, keep the printing on the outside of the bag.
For More Information, Visit the Following Link: U.S. Environmental Protection Agency (USEPA) (2004). Sources of Indoor Air Pollution: Lead. Accessed April 2004 at http://www.epa.gov/iaq/lead.html.
Methodology
Calculations of lead poisoned children in this report were based upon the results of the Third National Health and Nutrition Examination Survey (Phase 2, 1991-1994), as described in the Centers for Disease Control and Prevention's "Update: Blood Lead Levels - United States, 1991-1994" in the Morbidity and Mortality Weekly Report (February 21, 1997, Vol. 46, No. 7). Prevalence rates were adjusted to account for findings reported in the Morbidity and Morality Weekly Report (Sept. 12, 2003, Vol. 52, No. SS-10) "Surveillance for Elevated Blood Lead Levels Among Children - United States, 1997-2001." Population, income, and housing statistics were acquired from the United States Census 2000, Summary File 3.
Step 1: Determining Populations
According to the study discussed in the CDC's reports, the best indicators for lead poisoning risk of children are income level and age of housing, with percentages of poisoned children increasing as income gets lower and housing gets older. The study measured income in Poverty to Income Ratios (PIR), which is the ratio of total family income to the poverty threshold. Low income was defined as PIR <= 1.300, middle income as PIR 1.301-3.500, and high income as PIR >=3.501. The study also used three housing ranges, which roughly correspond to periods in which household lead usage changed. Old housing was built before 1946, medium-aged houses were built between 1946 and 1973, and new housing was built after 1973.
The primary geographic unit for our calculations is the census tract, which is the smallest area for which there is population and housing information available with the necessary level of detail. To match the categories in the study, we divided the total number of children in a census tract into categories based upon the percentages of housing units and children that fall into their respective ranges. This gives us nine population groups to use in our calculations.
Step 2: Compute Estimate of Lead Poisoned Children
The CDC report provides percentages of children aged 1-5 years which have blood lead levels greater than or equal to 10 µg/dL (the level at which they consider a child to be poisoned) for each combination of income and housing populations. Since the 2003 CDC paper reports that national prevalence of lead poisoning has dropped to a national average of 2.2% in 2000, we decreased the risk percentages by 30% from the levels reported in the 1997 CDC report. This adjustment ensured that we did not overestimate the number of lead poisoned children in Ohio. The risk percentages we used are in the following table:
| Before 1946 | 1946 to 1973 | After 1973 | |
|---|---|---|---|
| Low Income | 11.48% | 5.11% | 3.01% |
| Medium Income | 2.87% | 1.40% | 0.03% |
| High Income | 0.63% | 1.89% | 0% |
Percentage of Children with Lead Poisoning in the Nine Population Categories
To determine the number of children with lead poisoning in a census tract, we multiplied the number of children in each of the nine populations by their respective prevalence percentage, and added the results together.
Step 3: Computing State, County, and Neighborhood Estimates
The county and state estimates are simply the aggregate of poisoned children computed by census tract. To allow people to determine the risk of lead poisoning in their immediate vicinity, we also computed estimates at the Census Block Group, or "Neighborhood", scale. To calculate these estimates we distributed the number of poisoned children in a census tract into its component block groups using the more generalized income and housing census data available for that summary level.
Medicaid Estimates
Using data released by the State of Ohio Department of Health we determined the exact number of medicaid eligible children which were not screened. To calculate how many of these are estimated to be lead poisoned we used a methodology very similar to the one used for the census tract estimations. Because all Medicaid eligible children should fall into the low-income range, we divided them into three populations based on the housing percentages in the county. We applied the same percentages as above to the populations, and added together these results to get the estimated number of medicaid eligible children with lead poisoned children who were not identified.
Zip Code Hot Spots
While the census does provide information based on Zip Code Tabulation Areas, these regions do not correspond exactly with the Postal Zip Codes which people would be using to identify the risk for an area. Therefore, we could not provide estimates of risk by percentage of the population or number of children poisoned within a zip code. Instead, our list of Zip Code Hot Spots contains the Postal Zip Codes that contain one or more High Risk (>5% of children poisoned) Neighborhoods.
Sources of Uncertainty and Underestimation
There are several known sources which may have produced errors in these calculations, most of which result in a more conservative estimate of poisoned children. The first is the original CDC report, which was conducted with the relatively small sample size of 2,392 children, leading to a broad confidence interval. We encourage the CDC to conduct further research on the prevalence of lead poisoning to yield more reliable estimates.
Although the CDC study used a PIR value of 3.5 to divide the middle and high income populations, census data has only been released with PIR ranges up to 2.0. This means that we were forced to group many children into the high income population who in reality fall into the medium income group, and therefore have a higher risk of lead poisoning.
The largest source of underestimation was our assumption that the state-wide prevalence of lead poisoning in Ohio was the same as the national average of 2.2%. This most likely results in a very conservative result since the 2003 CDC paper reports that Ohio has the third highest number of pre-1950 housing units in the country, and therefore most likely has rates of lead poisoning that far exceed the national average. Testing rates support this, since in 2001, 6.47% of children tested in Ohio were found to have lead poisoning.
Maps
Estimated number of Lead Poisoned Children