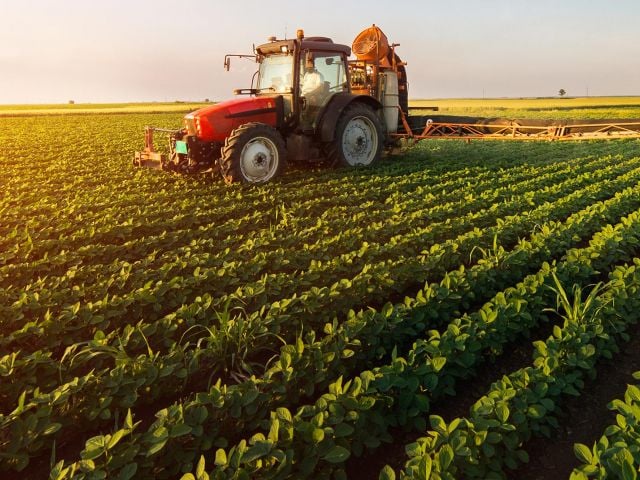
Across America’s heartland, in county after county and state after state, the landscape-devouring machinery of modern agriculture has been churning through millions of acres of irreplaceable wetlands and fragile, highly erodible grassland and prairie.
Enticed by record-high prices for crops and a cornucopia of federal subsidies, growers have moved rapidly over the last five years to plant corn, soy and other row crops across vast swaths of previously uncultivated land. The trend has devastated critically important habitat for vast numbers of migratory birds and other species and left sensitive areas exposed to the ravages of an increasingly unstable climate.
Thanks to modern mapping and geospatial technologies, the consequences are today measurable with unprecedented precision.
Environmental Working Group (EWG) used the technologies to conduct a unique analysis of these trends, which revealed that from 2008 to 2012, 1.9 million acres (nearly 3,000 square miles) of wetlands and nearby habitat went under the plow. During the same period, 5.3 million acres (8,300 square miles) of highly erodible land was similarly “broken out” to grow row crops. Even more troubling, the mapping shows that conversion of these fragile lands is concentrated in regions that are both ecologically important and highly vulnerable to degradation.
The new report is a follow-up to EWG’s widely cited Plowed Under report, released in February 2012, which found that over the four years from 2008 to 2011, a massive total of 23.6 million acres of grassland, wetland and shrubland – an area larger than Indiana – had been converted to row crops. The new analysis takes a closer look at those data, identifying areas where conversion of wetlands and fragile land to row crops is most extensive.
EWG focused on areas where large blocks – 10 acres or more – of wetlands, wetland buffers or highly erodible land had been plowed up. Finally, the analysis identified “hotspot” counties, those where either:
- 2.5 percent of pre-existing wetlands had been converted, so long as the total was at least 2,500 acres; or
- 2.5 percent of pre-existing highly erodible land had been converted, so long as the total was at least 2,500 acres.
(See Appendix for full details of the methodology.)
EWG's county-by-county look revealed the "hotspots" where plowing up of wetlands and highly erodible land has been most intensive.
Loss of wetlands has been particularly dramatic in just three states – South Dakota, North Dakota and Minnesota – which together account for 39 percent (731,000 acres) of all wetland and nearby habitat acres converted to row crops from 2008 to 2012. Exploitation of highly erodible land is more widespread, with 10 states – Texas, Colorado, Oklahoma, Montana, North Dakota, Iowa, Missouri, South Dakota, Kansas and Nebraska – accounting for 57 percent (3.0 million acres) of the acreage converted to row crops during that period.
Wetland and Wetland Buffers
Plowing up large areas of wetlands and wetland buffers (vegetation within 500 feet of a wetland) has been concentrated in the heart of the critically important Prairie Pothole region. This unique landscape is considered one of the most important wetland regions in the world. More than 50 percent of North American migratory waterfowl depend on its complex mix of wetlands and grassland. The maze of wetlands also holds back flood waters and reduces the amount of fertilizer and farm chemicals that end up in water.

The Prairie Pothole region is one of the most important wetland areas in the world. (Photo: U.S. FWS)
Over the years, more than half of the Prairie Pothole wetlands have been lost to farming. Although the National Wetland Inventory reported a small but encouraging increase in freshwater wetlands from 2004 to 2009, the intensive cultivation occurring now because of a combination of high crop prices and the over-subsidized crop insurance program has reversed that limited progress.
EWG’s findings echo a study published in February 2013 in the Proceedings of the National Academy of Sciences, titled Recent Land Use Change in the Western Corn Belt Threatens Grassland and Wetlands. Scientists at South Dakota State University found that 1.3 million acres of grassland in the Western Corn Belt (North Dakota, South Dakota, Nebraska, Minnesota and Iowa) had been converted to corn and soybean fields between 2006 and 2011. In their most troubling finding, the authors pointed out that planting of row crops in what had been grassland was “concentrated in close proximity to wetlands, posing a threat to waterfowl breeding in the Prairie Pothole Region.” They concluded that the accelerating trend “represents a persistent shift in land use rather than short-term variability in crop rotation patterns.”
A second study, Wetland Losses Due to Row Crop Expansion in the Dakota Prairie Pothole Region, published in January 2013 in Wetlands, the journal of the Society of Wetland Scientists, reported that in eastern North and South Dakota alone, 153,000 acres (240 square miles) had been lost to agriculture from 2001 to 2011 in just that portion of the Prairie Pothole region – equivalent to losing 15,300 acres of wetlands a year.
Overall, EWG found that a total of 21 counties lost more than 10,000 acres each of wetlands and wetland buffers, accounting for nearly a third of all losses across the hotspot 170 counties for wetland conversion. Twenty of the 21 counties are in the Dakotas and Minnesota.
Wetlands and Wetland Buffer Conversion Hotspots, 2008-2012
For an interactive map showing county-by-county conversion rates, click here.

EWG’s analysis revealed that in a few cases, land that had been planted with row crops was converted back to wetland or wetland buffers between 2008 and 2012. But the wetland gain in hotspot counties (228,000 acres), was dwarfed by the losses of 1,017,097 acres (1,600 square miles). In the 21 counties that lost more than 10,000 acres each, losses outstripped gains by a factor of 8-to-1. Only eight of the 170 hotspot counties (six in Texas and two in California) showed a net gain in wetland and wetland buffer acreage.
Corn and soybeans were planted on 60 percent (612,000 acres) of the wetland and wetland buffer acres appropriated for row crop production (Figure 1) in hotspot counties.
Figure 1: Corn and soybeans were planted on 60 percent of converted wetland acres

The rapid pace of wetland destruction between 2008 and 2012 documented by EWG and other studies is seriously threatening this unique natural resource. If it is not reversed soon, the effect on migratory waterfowl, water quality and the ecology of the Prairie Pothole region will be devastating.
Highly Erodible Land
Plowing up highly erodible land to raise crops greatly increases the risk of soil erosion and polluted runoff unless growers take strong conservation measures. And as with wetlands, the trend of “breaking out” highly erodible land for row crop production has been highly concentrated geographically.
Highly Erodible Land Conversion Hotspots, 2008-2012
For an interactive map showing county-by-county conversion rates, click here.

Between 2008 and 2012, a total of 5.3 million acres of previously uncultivated, highly erodible land was planted with row crops. Fully 73 percent of that conversion occurred in 425 hotspot counties EWG identified.
The amount of highly erodible land newly placed into row crop production in those counties ranged from 2,516 acres in Wheeler County, Neb., to 99,399 acres in Texas County, Okla. The 25 hotspot counties with the highest rates of conversion accounted for 26 percent of all highly erodible land converted, although they were just 6 percent of the hotspot counties.
Plowing up highly erodible land is concentrated in the Great Plains from Montana to Texas – areas vulnerable to drought and devastating rates of erosion. The hotspot region at the intersection of Colorado, Kansas, Oklahoma and Texas was ground zero for the Dust Bowl – a massive ecological disaster that devastated a large swath of the United States during the 1930s as a result of persistent drought combined with poor farming practices on fragile land that had once been covered with grass.
The hotspot counties in the Great Plains states also overlap to an alarming extent with critical habitat for the swift fox, sage grouse, lesser prairie chicken and mountain plover. Many of these species are in decline but not yet protected under the Endangered Species Act, but the rapid pace of land conversion EWG found might well accelerate efforts to bring them under federal protection.
North Dakota, South Dakota and northeast Montana have been hard hit by conversion of both wetlands and fragile land into crop production. South Dakota has lost more wetlands and wetland buffers than any other state, and North Dakota is just behind. Both are also among the top 10 states in the amount of highly erodible land that has been plowed up: North Dakota is fifth and South Dakota is eighth. The pace and intensity of this fundamental alteration of the landscape in these two states is remarkable – and alarming.
A separate set of hotspot counties at the intersection of southeastern Minnesota, southwestern Wisconsin and northeastern Iowa threatens the Driftless Area - http://www.driftlessareainitiative.org/maps.cfm, another unique and environmentally sensitive landscape. This region escaped the last glaciation (hence the term Driftless) and features deep valleys between towering limestone bluffs. The area is home to miles of cold-water trout streams and is the focus of a major initiative led by Trout Unlimited to restore and improve the region’s streams. Plowing up highly erodible land poses a direct threat to those efforts unless growers implement intensive conservation measures to prevent erosion and runoff from newly plowed cropland.
EWG's analysis did detect a few cases in which highly erodible land that had been planted with crops was converted back to grass or other vegetation. But the acres reverting to grass (1.1 million acres) were far outstripped by the acres being converted to cropland (3.9 million acres) in the 425 counties that were hotspots for newly planted highly erodible land. In the 101 counties where more the 10,000 acres of highly erodible land were placed into crop production, converted acres outstripped acres that reverted to grass by a factor of 3-to-1. Only 10 of the 425 hotspot counties showed a net gain in acres of highly erodible land planted with grass or other non-crop vegetation.
Wheat and corn were the primary crops planted on highly erodible land in EWG’s analysis and account for 54 percent (2.1 million acres) of the converted acreage. Another 16 percent (636,000 acres) was idle or left fallow. (Figure 2)
Figure 2: Wheat and corn were planted on 54 percent of converted highly erodible land.

Congress Must Act
The so-called conservation compliance provisions of the farm bill are by far the most important federal policies that could slow or reverse the environmental disaster underway as more and more fragile land goes under the plow. Since 1985, these common-sense provisions have required farmers who accept federal subsidies to take basic measures to cut soil erosion on their most highly erodible fields and to refrain from draining wetlands. This conservation quid pro quo cut soil erosion on highly erodible cropland by 40 percent and essentially stopped wetland drainage on agricultural land. Moreover, a solid majority of farmers has consistently supported this conservation compact with taxpayers.
As it moves to reauthorize the farm bill this year, however, Congress is threatening to gut these critical provisions. Both the Senate and House have passed versions of a new farm bill that would replace the major traditional farm subsidies with new programs that expand already heavily subsidized crop insurance. The Congressional Budget Office (CBO) estimates that the existing crop insurance program will cost taxpayers $90 billion over the next 10 years – nearly twice as much as the subsidy programs being eliminated. The bills currently under consideration would add another $30 billion or more to the cost.
Taxpayers pay, on average, 60 percent of crop insurance premiums, and in some cases the entire cost. These premium subsidies are worth tens of thousands of dollars to farmers and on a per-acre basis are more generous for most growers than the farm programs slated for repeal.
However, premium subsidies have not been covered by the same conservation quid pro quo that applies to other farm programs. Congress broke that link in 1996. The pending Senate version of the farm bill would restore the link; the House version would not.
The Senate bill also includes a critically important “Sodsaver” provision that reduces crop insurance premium subsidies on native prairie or grassland that is planted with crops. The House version includes a much weaker provision.
This map shows why it is vital that the final version of the farm bill restore the conservation quid pro quo for crop insurance subsidies. (Figure 3) The map reveals a remarkable correlation between counties that are hotspots for conversion of wetlands, wetland buffers and highly erodible cropland and those with highest average payouts from crop insurance.
Figure 3: Hotspots for conversion are also hotspots for crop insurance payouts
Click here to see a larger version of this map.

Between 2008 and 2011, the average crop insurance payout for all 3,109 covered counties was $2.3 million per county. In the 71 counties that lost more than 5,000 acres of wetlands and wetland buffers, however, the average payout was $10.1 million – more than four times the average. The average payout in the 235 counties that were hotspots for conversion of highly erodible land was $5.8 million – two and a half times the average. In the 12 counties that were hotspots for both wetland and highly erodible land conversion, the average payout was $7.5 million.
The total payout in the 294 counties with the highest rates of conversion was an astounding $8.3 billion.
These data strongly suggest that over-subsidized crop insurance policies are greasing the wheels of conversion to row crops. The government is picking up too much of the risk of plowing up and planting fragile land and landowners too little, all at a cost of billions of dollars to taxpayers and untold environmental degradation.
The data also show just how effective re-attaching the conservation quid pro quo to premium subsidies and adding a strong Sodsaver provision would be in slowing wetland conversion and protecting millions of acres of fragile land. Strengthening the conservation compact is the single most important action Congress could take to halt the environmental disaster taking place as millions of acres of environmentally sensitive land go under the plow.
Appendix
Methods
EWG first analyzed data from USDA’s Cropland Data Layer to produce a broad picture of the expansion of cropland acres from 2008 to 2011. The findings, published in Plowed Under in February 2012, led analysts at EWG to dig deeper into the USDA’s data to pinpoint where large blocks of environmentally sensitive land was being converted to growing row crops. We focused on conversion of (1) wetlands and wetland buffers (vegetation within 500 feet of a wetland) and (2) highly erodible land.
We adapted the methods used by Wright and Wimberly in their analysis of land use change in the Western Corn Belt to identify “Hotspots” – counties that were experiencing a disproportionately large amount of wetland or highly erodible land conversion.
To accomplish this “Hotspot” analysis, we mapped intensive conversion of fields of 10 acres or more and then intersected it with a footprint of highly erodible land tracts, delineated wetlands and surrounding buffer areas. Following the intersection, thresholds were applied at a county level to extract “Hotspots” of highly erodible and wetland conversion.
For the contiguous 48 states, the 2008 through 2012 USDA Cropland Data Layers were classified into two universes; vegetative and cropland (see the CDL category classification in Appendix Table 1).
We applied two filtering methods in an effort to minimize two potential sources of error. The first source of error is created by changes in CDL pixel sizes between 2008 and 2012. In 2008 and 2009, the CDL pixels were 56m by 56m. In 2010, 2011 and 2012, however, pixel sizes were much smaller – 30m by 30m. This difference in pixel size can induce an “edge effect” when pixels of different sizes overlap. The second potential source of error arises when very small areas identified as one land use are embedded within a much larger continuous acreage identified as a different land use. The first filter was applied to all annual vegetative and cropland universes and only features with a contiguous area of greater than 10 acres were retained for analysis. Next, all layers were combined, based on their respective land use categories, into a density map, which was again filtered for contiguous areas greater than 10 acres. The finalized maps were then tracked yearly to capture areas of directional change (cropland to vegetative or vegetative to cropland).
These conversions were summarized with the latest CDL (2012) to extract current and relevant land covers. After this step, the Common Land Units (USDA) designated as HEL and areas designated as wetlands in the National Wetland Inventory (USFWS) were rasterized (30m) and intersected with the conversion maps. A 500-foot buffer around the NWI wetlands layer was created to analyze changes in land cover immediately adjacent to wetlands.
Once the final conversion maps were calculated, they were totaled and assessed for classification accuracy at a county level. Confidence reflects the USDA’s measure of land cover classification per pixel for the 2012 Cropland Data Layer. To extract the county level “Hotspots”, thresholds of greater than 2.5 percent of total county universe (for HEL or wetlands) and 2,500 acres converted from vegetation to cropland were applied.
Table 1
|
Land Cover Types Classified as Vegetative |
|
| CDL Code | CDL Cover Type |
| 37 | Other Hay/Non Alfalfa |
| 62 | Pasture/Grass |
| 87 | Wetlands |
| 171 | Grassland Herbaceous |
| 181 | Pasture/Hay |
| 190 | Woody Wetlands |
| 195 | Herbaceous Wetlands |
| 152 | Shrubland |
| 141 | Deciduous Forest |
| 142 | Evergreen Forest |
| 143 | Mixed Forest |
|
Land Cover Types Classified as Cropland |
|
| CDL Code | CDL Cover Type |
| 1 | Corn |
| 5 | Soybeans |
| 24 | Winter Wheat |
| 61 | Fallow/Idle |
| 2 | Cotton |
| 23 | Spring Wheat |
| 4 | Sorghum |
| 26 | Double Crop - Winter Wheat/Soybeans |
| 21 | Barley |
| 3 | Rice |
| 22 | Durum Wheat |
| 42 | Dry Beans |
| 31 | Canola |
| 10 | Peanuts |
| 6 | Sunflower |
| 28 | Oats |
| 41 | Sugar beets |
| 43 | Potatoes |
| 45 | Sugarcane |
| 237 | Double crop - Barley/Corn |
| 235 | Double crop - Barley/Sorghum |
| 254 | Double crop - Barley/Soybeans |
| 241 | Double crop - Corn/Soybeans |
| 234 | Double crop - Durum wheat/Sorghum |
| 232 | Double crop - Lettuce/Cotton |
| 230 | Double crop - Lettuce/Durum wheat |
| 226 | Double crop - Oats/Corn |
| 239 | Double crop - Soybeans/Cotton |
| 240 | Double crop - Soybeans/Oats |
| 225 | Double crop – Winter wheat/Corn |
| 238 | Double crop – Winter wheat/Cotton |
| 236 | Double crop – Winter wheat/Sorghum |
| 53 | Peas |
| 29 | Millet |
| 27 | Rye |
| 52 | Lentils |
| 12 | Sweet Corn |
| 32 | Flaxseed |