Environmental Working Group’s updated Farm Subsidy Database, released May 5, chronicles where federal farm subsidy dollars have gone from 1995 through 2009, revealing the true impact of farm programs and showing who really benefits from the billions in farm subsidies U.S. taxpayers pay out each year. This analysis goes a step further by examining the economic condition of the farmers and landowners who take home this government money and the broader economic context in which these payments are made.
Our work confirms that current farm programs hardly qualify as a safety net for the family farm but are instead a taxpayer giveaway to big and already profitable farming businesses. Moreover, these payments are likely exacerbating, rather than solving, the problems of rural communities.
Economic Context
Farm country has been doing pretty well the last few years. The five best years ever for farm income have all come since 2003, and 2010 is projected to be near those highs.1 The latest year for which we have data, 2008, was one of those good years, even though farm income was down from the record high of 2007 and slightly lower than the preceding three years, thanks to the start of the worldwide recession. For farmers, 2008 might have been a more profitable year compared to historic trends, but it is representative of the new standard of farm income.
In 2008, the median income for farm households of all sizes was $50,971. This was similar to the $50,303 median for all households.2 But farm households are earning more than $10,000 (25 percent) more than their rural neighbors. The median rural (non-metro) income is just $40,785.3 The average (mean) farm income was $78,803, vs. a national average of $68,424.4
Despite the fact that farm households are doing as well or better than others, the federal government targeted some of those households for billions of dollars in government payments. In 2008, that total amounted to more than $12 billion, according to the US Department of Agriculture’s Economic Research Service. (That’s slightly more than the total computed by EWG, not including crop insurance subsidies.) These payments went to only 39 percent of all farms, and the average payment was $11,922.5
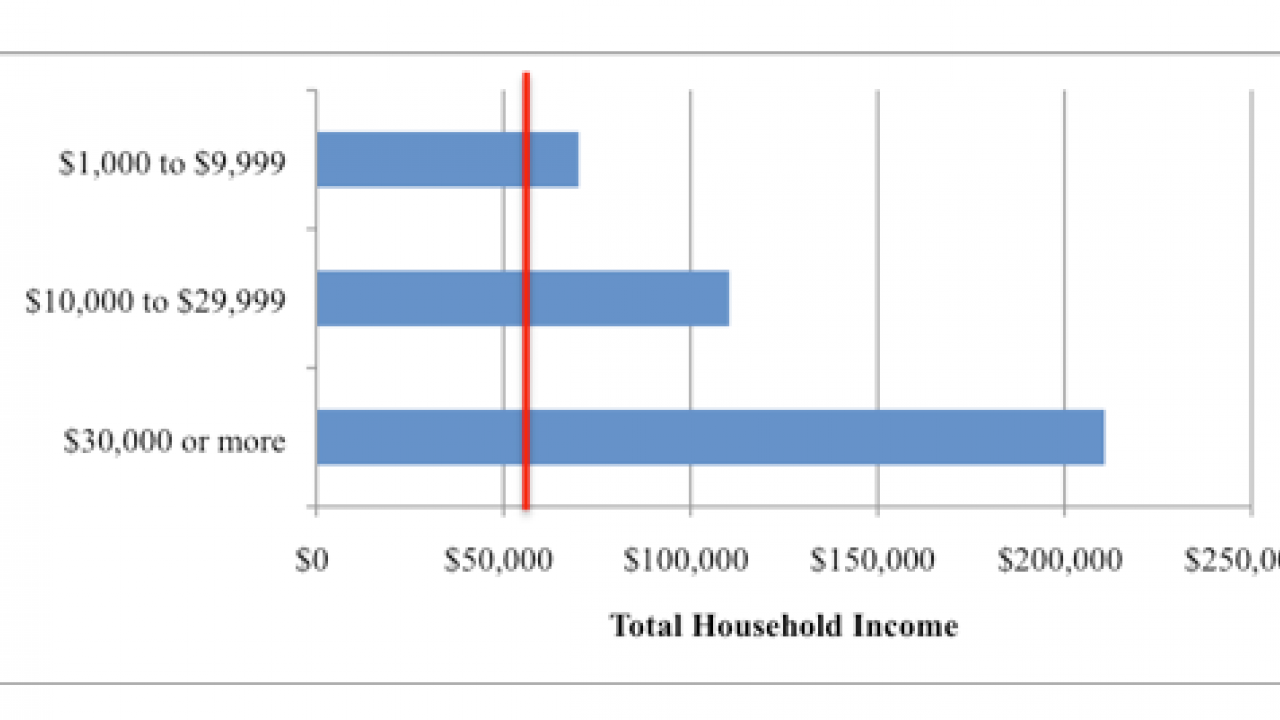
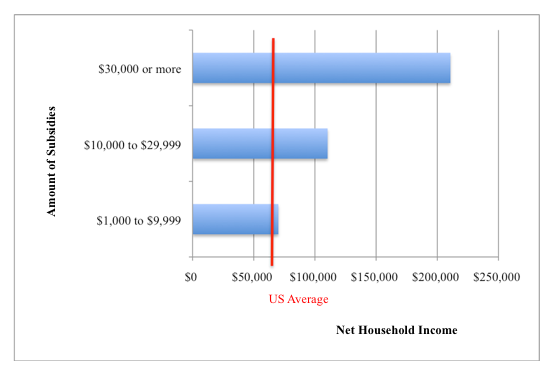
The skewed distribution of subsidy payments is even more striking when you compare the amount of subsidies received to the household income of the farming operations receiving them. The average household income of farms that received $30,000 or more in government payments was above $210,000 in 2008, more than three times the average U.S. household income that year. Farming operations that received between $10,000 and $29,999 in subsidies earned $110,368 in total household income, 61 percent more than the U.S. mean household income. And the household income of farms that got between $1,000 and $9,999 in subsidies was $70,117, still above U.S. average.
Moreover, EWG’s database shows that in 2008, the top recipients of subsidies were corn, soybeans, and wheat – exactly those crops that were benefiting from high prices due in part to federal mandates to use more corn to produce ethanol. Rather than providing a safety net to help farmers in a time of need, the government was sending money to people who were already pretty well off.
Already Profitable Commercial Farms Are Big Winners
Large and profitable commercial farms are the big winners in the current distribution of farm subsidies. The ERS data indicate that large commercial farms collected 62 percent of all federal payments. A further breakdown of the data shows that small farms averaged $4,430, though a large share of this came from conservation programs as opposed to commodity subsidies. However, less than 30 percent of small farms received any payment at all. In contrast, 70 percent of commercial farms – which have much higher incomes to start with – received an average payment of $30,483, with direct payments constituting the major component.
The following USDA graph tells the story. (Commercial farms are those that have sales of $250,000 or more; intermediate farms are operations with smaller sales but whose operators report agriculture as a full-time occupation; rural residence farms include retirement and residential farms.)

Clearly, small farms are benefitting very little, particularly when you exclude conservation programs. And the data make it clear that payments are poorly targeted in relation to need. In 2008, small and medium farmers actually had negative on-farm incomes. The entirety of their income was secured off the farm. Yet it was the large commercial farms that pulled in government subsidies in addition to their profits. The USDA graph below demonstrates that the income picture for intermediate farms is not as rosy as the aggregate data suggests, because large commercial farms are doing so well. Nonetheless, our farm programs are doing little to help the struggling middle of the agriculture sector.

Small Farms Depend on Off-Farm Jobs
The ERS data clearly show that smaller family farms depend on off-farm income to keep going. As anyone from farm country knows, family farms often rely on one member to work a different job in the community, whether for extra income, to obtain health insurance, or both. This pattern has become the norm in rural America and, unlike federal farm subsidies, it has allowed small farms to stay in business. Off-farm income is perhaps the main reason farm households do so well compared to all U.S. households. As ERS reports, “every year since 1996, average income of farm households has exceeded average U.S. household income. In fact, the off-farm income component (of average farm operator household income) alone has exceeded average U.S. household income from all sources since 1998.”
Small and medium farm households are not relying on government subsidies to help them make ends meet. Instead, they have developed their own revenue insurance policies in the form of off-farm income. This gives support to Secretary Vilsack’s recent comments on the need to bolster rural economies as the foundation for rural growth and prosperity, rather than relying on subsidies. (See this report from the Center for the Study of Rural America at the Federal Reserve Bank of Kansas City).
Saving the Family Farm?
If farm subsidies are not benefitting small family farms and keeping them on the land, as the programs’ defenders claim, then what other justification is there to maintain them? The most commonly heard is that subsidies are essential for production agriculture to produce the safe, abundant food supply this country enjoys. Commercial agriculture needs this money to be viable, they say. Once again, the numbers prove them wrong.
Government payments provide a very small portion of the income for commercial agriculture. When considering only those operations receiving payments, subsidies represent less than 4 percent of their total gross income, hardly a make-or-break sum. Even after taking into account production expenses such as fertilizer, fuel, and labor – subsidies account for only about 20 percent of net farm sector income overall. For commercial farms, the percentage is even lower. When combined with the data presented above, which showed that farm operations receiving payments are already doing much better than the average household, it becomes clear that federal subsidies are merely augmenting already high incomes rather than propping up low ones.

Put another way, the government is sending large sums of money to farms that are already making big profits. As the table below shows, farms receiving $30,000 or more in subsidies in 2008 had an average net income of $210,738. It defies logic to argue that a business making this much net income needs additional government assistance to stay in business.
Nevertheless, this is exactly what we subsidy defenders claim. A May 5 Associated Press news story quoted cotton farm owner Randolph Rogers saying just this: “Everybody just acts like we just put our [government] money in our pockets. But it takes that money to operate.”6 Looking at the data, it is hard to believe that this is actually the case for the farm sector as a whole.
Reform is Long Overdue
ERS data clearly show that farm subsidies are not distributed based on any standard of need. Indeed, farm subsidies are flowing to households with incomes substantially above either U.S or rural households. Moreover, the vast majority of subsidies are captured by large and already profitable commercial farms.
Rather than saving the family farm, current subsidies are likely making it hard for family farms to stay on the land. With the promise of a set annual payment based on the land, subsidies have been built into the cost of farmland and cash rents. This has made it harder for beginning farmers to enter the business and for small farmers to expand. Instead, the subsidies that flow to the larger farms have given those owners and operators a cash flow advantage that has allowed them to invest in additional land or better technology. The ability of smaller farms to compete with this taxpayer-funded advantage is one of the factors contributing to industry consolidation and the disappearance of small family farms.
This analysis looked at income data from one year as an example of longer trends. The truth is far more complex than these aggregate data suggest, and there certainly are wide variations in income for individual farm households and from year to year. Furthermore, the fact that the government still paid out $12 billion in a good year for agriculture calls for reexamining the meaning of “safety net.”
Unfortunately, the current subsidies clearly fail the test of being targeted to those most in need or sustaining small family farms, not to mention the need for fiscal restraint with taxpayer dollars. Congress should use the next farm bill to construct a system that passes those tests.
|
Table –Farm operator household income, by level of farm government payment level, 2008 |
|||||
| Level of Government Payment | |||||
| Item |
No payment
|
$1 to $9,999
|
$10,000 to $29,999
|
$30,000 or more
|
All
|
| Number | |||||
| Number of farms | 1,315,632 | 600,527 | 141,392 | 72,318 | 2,129,869 |
| Dollars per family farm | |||||
| INCOME OF THE FARM BUSINESS | |||||
| Net cash farm income of business | 2,378 | 15,323 | 96,856 | 271,827 | 21,449 |
| Gross cash income | 46,537 | 78,169 | 357,557 | 1,033,959 | 109,630 |
| Livestock income | 17,752 | 35,255 | 94,379 | 213,294 | 34,413 |
| Crop sales (incl. net CCC loans) | 20,717 | 30,190 | 206,707 | 636,158 | 56,632 |
| Government payments | 0 | 2,880 | 17,287 | 64,651 | 4,155 |
| Commodity payments | 0 | 1,995 | 12,910 | 49,976 | 4,166 |
| Conservation payments | 0 | 1,132 | 4,369 | 11,109 | 1,286 |
| Other farm-related income | 8,068 | 9,844 | 39,184 | 119,856 | 14,430 |
|
|
|||||
| Cash expenses | 44,159 | 62,846 | 260,701 | 762,132 | 88,182 |
| Variable | 35,956 | 49,721 | 201,972 | 596,820 | 69,902 |
| Livestock purchases | 2,153 | 2,713 | 10,570 | 49,186 | 4,467 |
| Feed | 6,589 | 8,760 | 26,339 | 64,603 | 10,482 |
| Other livestock-related | 943 | 3,899 | 4,155 | 9,804 | 2,291 |
| Seed and plants | 2,187 | 3,543 | 22,282 | 63,737 | 5,993 |
| Fertilizer and chemicals | 3,273 | 8,881 | 54,926 | 170,913 | 13,975 |
| Labor | 8,298 | 4,542 | 19,550 | 67,304 | 9,989 |
| Fuels and oils | 3,147 | 5,067 | 22,366 | 63,871 | 7,026 |
| Repairs and maintenance | 3,241 | 5,179 | 18,800 | 43,372 | 6,183 |
| Machine-hire and custom work | 956 | 2,039 | 6,654 | 20,699 | 2,310 |
| Utilities | 1,799 | 1,904 | 6,084 | 18,365 | 2,675 |
| Other variable expenses | 20,810 | 21,923 | 83,700 | 238,578 | 32,693 |
|
|
|||||
| Fixed | 8,203 | 13,125 | 58,729 | 165,312 | 18,279 |
| Real estate and property taxes | 2,234 | 2,688 | 5,937 | 9,652 | 2,859 |
| Interest | 3,061 | 3,961 | 14,187 | 37,850 | 5,234 |
| Insurance premiums | 1,401 | 2,824 | 11,974 | 33,918 | 3,608 |
| Rent and lease payments | 1,508 | 3,652 | 26,631 | 83,893 | 6,578 |
|
|
|||||
| INCOME OF THE FARM HOUSEHOLD | |||||
|
|
|||||
| Total household income of farm operators | 72,936 | 70,117 | 110,368 | 210,738 | 78,803 |
|
|
|||||
| Net cash farm earnings of household | -2,813 | 5,300 | 55,736 | 156,495 | 8,770 |
|
|
|||||
| Off-farm income of the household | 75,750 | 64,817 | 54,632 | 54,244 | 70,032 |
| Earned income | 56,868 | 44,150 | 38,410 | 33,508 | 50,761 |
| Off-farm wages and salaries | 47,393 | 37,930 | 33,462 | 27,030 | 42,606 |
| Off-farm business income | 9,475 | 6,220 | 4,948 | 6,478 | 8,155 |
| Unearned income | 18,881 | 20,667 | 16,222 | 20,736 | 19,271 |
| Interest income | 1,874 | 2,849 | 3,023 | 4,360 | 2,310 |
| Dividend income | 1,459 | 1,472 | 1,972 | 3,858 | 1,578 |
|
Retirement and other transfer income |
12,114 | 12,429 | 7,777 | 6,476 | 11,723 |
|
Transfer income from public sources |
8,469 | 8,558 | 6,044 | 5,265 | 8,224 |
|
Transfer income from private sources |
3,645 | 3,871 | 1,734 | 1,211 | 3,499 |
| Other off-farm income | 3,435 | 3,917 | 3,449 | 6,042 | 3,660 |
|
|
|||||
| Percent | |||||
|
|
|||||
|
Farm income as a percent of total farm household income |
-3.9 | 7.6 | 50.5 | 74.3 | 11.1 |
|
|
|||||
| Characteristics of principal operators | |||||
| <35 years old | 4 | 4 | 5 | 4 | 4 |
| >55 years old | 57 | 67 | 58 | 55 | 60 |
| Retired from farming | 20 | 23 | 12 | 6 | 20 |
| Farming as a major occupation | 35 | 48 | 76 | 89 | 43 |
|
Source: USDA Agricultural Resource Management Survey. |
|||||